Connecting the Global Copper Story to Indian Equities
Part 2 of the copper story. A higher copper price does not help every copper-related company in the same way — it depends on where the company sits in the value chain, whether growth is coming from price or volume, and whether margins are actually improving. Hindustan Copper, Hindalco, Vedanta, Jain Resource Recycling, Polycab, KEI, RR Kabel, Finolex, Ram Ratna and Precision Wires, each run through the same five questions.
In Part 1, the global copper story came down to a few simple points: mine supply is difficult to expand quickly, copper concentrate is especially tight, treatment charges have collapsed, and long-term demand is being supported by grids, renewables, EVs, data centres and industrial electrification.
Part 2 asks a different question: what do those same developments mean for Indian companies?
The first mistake would be to say: “Copper prices are rising, therefore all copper-related Indian companies will benefit.”
Different companies sit at different points in the copper chain, so the same copper rally can help one business while creating pressure for another.
The copper chain, made simple
Stage in the chain
Where Indian companies sit
Mine
Hindustan Copper
Concentrate
The raw material smelters need
Smelter / refinery
Hindalco, Vedanta, Kutch Copper
Copper products
Ram Ratna Wires, Precision Wires
Wires and cables
Polycab, KEI, RR Kabel, Finolex
The easiest way to connect Part 1 to Indian companies is to take each global development and ask what it does here.
Global copper story
What it means in India
Copper prices rise
Miners can earn better realisations. Downstream companies may also report higher revenue because selling prices rise.
Copper concentrate becomes scarce
Miners producing concentrate gain bargaining power; smelters face a harder raw-material environment.
Treatment charges fall
This generally pressures smelting economics, although by-products can offset part of the impact.
India electrifies
Demand rises for wires, cables, winding wires, transformers and electrical equipment.
Primary supply stays constrained
Recycling and raw-material security become more important.
The five-question checklist I will use
To keep the company analysis simple, every company is run through the same five questions.
Are sales growing quickly? First sign of momentum, but copper inflation can distort this.
Are actual volumes growing? Separates real business growth from higher copper prices.
Is EBITDA growing faster than sales? Shows operating leverage and better earnings quality.
Are EBITDA and PAT margins expanding? Shows whether growth is becoming more profitable.
Is there visibility that this continues? Capex, capacity, management guidance and demand determine what happens next.
Hindustan Copper: closest to the mine
Hindustan Copper is the easiest company to connect with Part 1 because it owns copper mines and produces copper concentrate. Concentrate is exactly the part of the global market that has become particularly tight.
Think of Hindustan Copper in the simplest possible way: it mines copper ore, processes that ore into copper concentrate, and can then either sell that concentrate or process it further into refined copper.
In FY26, the amount of copper concentrate it produced increased only from 25,241 tonnes to 27,421 tonnes, which is about 9% growth.
But its sales increased about 49% and PAT nearly doubled. So the big jump in profit did not come mainly from producing much more copper. It came because the copper it was selling was worth much more. Volume grew only 9%, but revenue grew much faster because the price per unit increased sharply.
Hindustan Copper can take its concentrate and process it further into copper cathode and wire rod. But in FY26, it chose not to do that with its own concentrate.
Why? Because management said it was getting better realisation by selling the concentrate directly.
So instead of mine copper → make concentrate → refine it → sell cathode, it chose mine copper → make concentrate → sell concentrate.
The logic is: “If buyers are already willing to pay me a very attractive price for the concentrate, why spend more money processing it further?”
And this connects directly to Part 1. Concentrate is scarce globally, and smelters need concentrate to run their plants. So when concentrate is scarce, the company that owns the concentrate has a stronger position.
That is why Hindustan Copper’s FY26 story can be reduced to just this: it produced a little more copper, but it earned much more because copper and concentrate became more valuable.
Going forward, the real opportunity would be higher copper prices and much higher production volumes. That would give Hindustan Copper both price growth and volume growth.
Checklist
Hindustan Copper
Sales growth
Strong: +49% in FY26
Volume growth
Positive, but production grew only ~9%
Earnings growth
Very strong: PAT nearly doubled
Future growth visibility
Depends heavily on mine expansion
Main question
Can production growth now accelerate?
The current story is roughly: better copper economics + modest production growth = very strong earnings growth. The stronger future story would be: supportive copper economics + much faster production growth = price and volume working together.
Hindustan Copper plans to expand mining capacity from around 4 MTPA towards 12.2 MTPA. That makes execution of the mining expansion more important than simply watching the copper price.
This entry is part of the members' archive. The full note continues for another eleven paragraphs, along with the underlying working and the spreadsheet built while reading through the filings.
It closes with the two questions worth putting to management on the next call, and what would have to change for the view to change with it.
Copper hit an all-time high on the LME and then held there even after the Fed raised rates. Two separate things are driving it — the world’s biggest mines are struggling to produce, and the threat of a US tariff has pulled a huge share of the world’s exchange copper into American warehouses. Yet some forecasters still expect a small surplus in 2026. How all of that can be true at once.
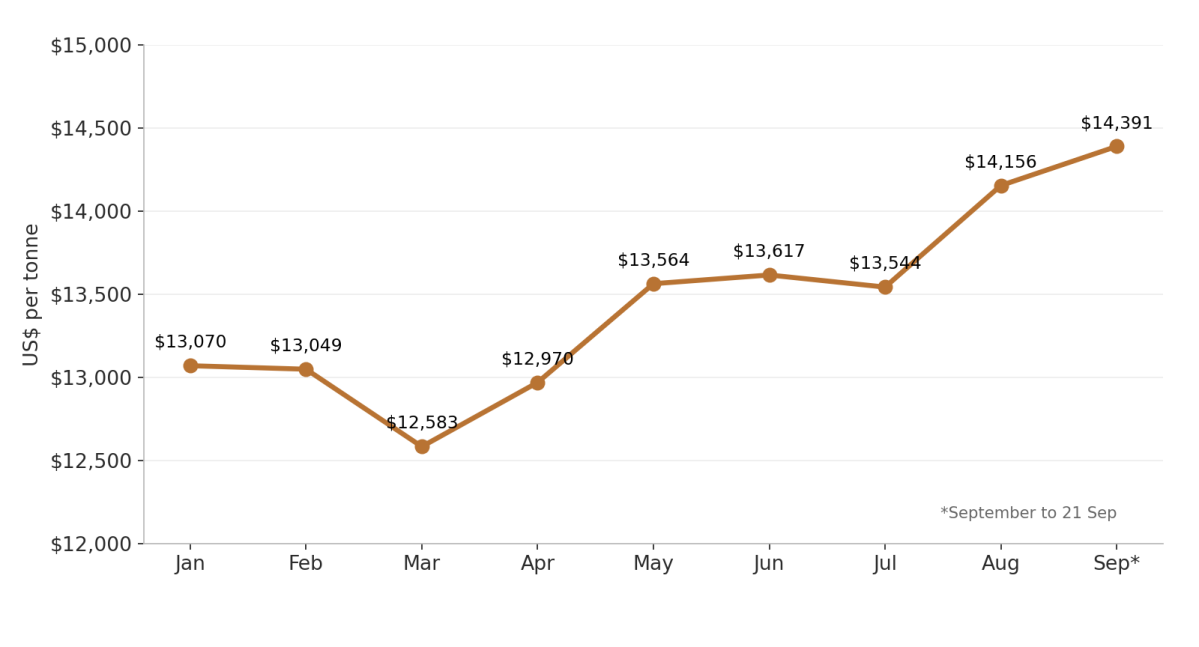
On 10 September 2026, copper touched an all-time high of $14,875 a tonne on the London Metal Exchange (LME). By 22 September, the three-month price was back at $14,760, close to that record.
Copper has climbed through 2026 (LME three-month price, monthly average). Source: LME official prices via Westmetall. September average covers 1 to 21 September.
Here is the interesting part. On 16 September, the US Federal Reserve raised interest rates by 0.25%, from 3.75% to 4.00%. Higher rates usually hurt industrial metals, because they slow down building, manufacturing and the wider economy. Copper went up anyway.
Two things are driving this.
First, the world’s biggest copper mines are struggling to produce more. Several have had serious setbacks, and new mines take many years to build.
Second, the chance of a US tax on imported copper has pushed traders to pile huge amounts of copper into American warehouses. That leaves less copper for buyers everywhere else.
But there is a twist. Despite all these problems, some forecasters still expect the world to produce slightly more refined copper than it uses in 2026.
How can all of this be true at once? To answer that, we need to look at how the copper market works.
Why copper matters
Copper carries electricity very well. That is why it is used in wiring, power lines, motors, transformers, vehicles and factory equipment.
Three areas matter most for future demand.
Power grids. As countries build more power plants and transmission lines, they need more cables, transformers and substations.
Electric vehicles. EVs use copper in their motors, batteries, wiring and chargers.
AI and data centres. Data centres need a lot of electrical equipment: power cables, transformers, cooling systems and backup power.
These are long-term sources of demand. But that does not mean people will buy copper at any price. When copper gets very expensive, manufacturers can delay purchases, use recycled copper, or switch to aluminium where they can.
So the real question is whether copper production can keep up.
The world’s copper mines are struggling
Normally, when prices rise, producers dig more. Copper doesn’t work that simply.
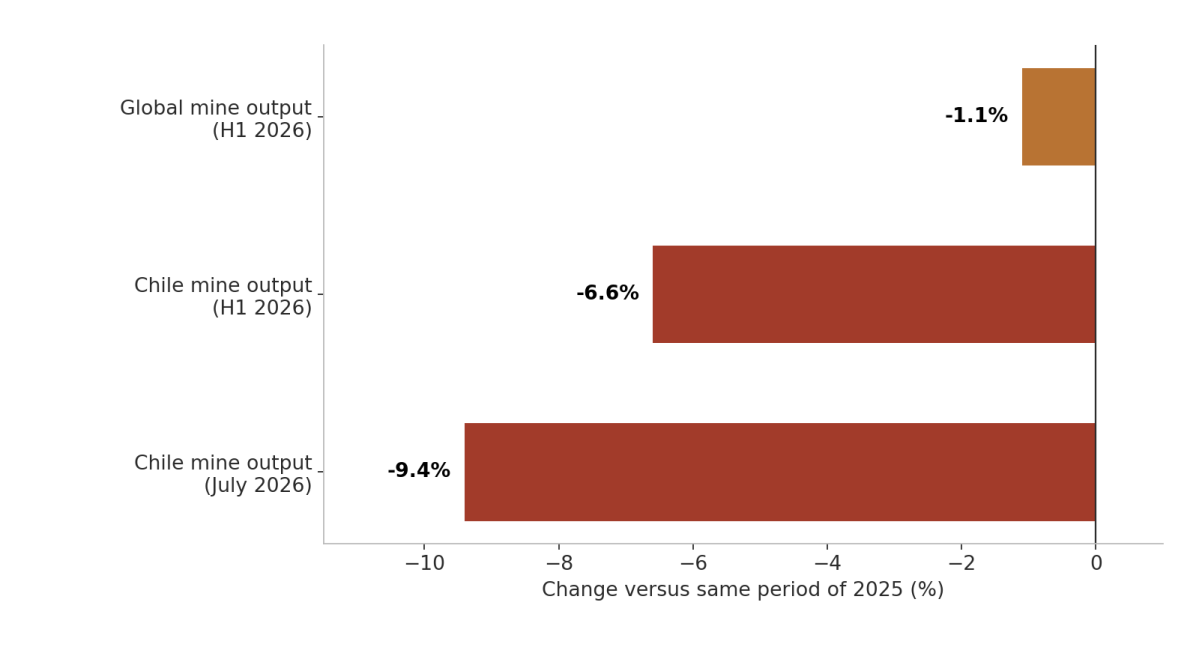
Global copper mine production fell 1.1% in the first half of 2026, even though prices were at records. If that does not recover, 2026 could be the first year since 2017 in which world mine output falls.
Mines are producing less copper, not more. Source: Sprott Asset Management, "Copper’s Rally Meets a Deepening Supply Crunch", 15 September 2026, citing International Copper Study Group (ICSG) data.
Chile, the world’s largest producer, is a big part of the problem. It produced about 23% of the world’s mined copper in 2025. Its output fell 6.6% in the first half of 2026 and another 9.4% in July.
Chile’s state copper commission, Cochilco, has cut its 2026 forecast to 5.27 million tonnes. Several large miners have also lowered their targets as they deal with accidents, bad weather and ageing mines.
Two mines show just how fragile copper supply can be.
Trouble at two major mines
Grasberg, Indonesia
Grasberg, run by Freeport-McMoRan, is the world’s second-largest copper mine. In September 2025, a mud rush flooded part of the underground mine and killed seven workers.
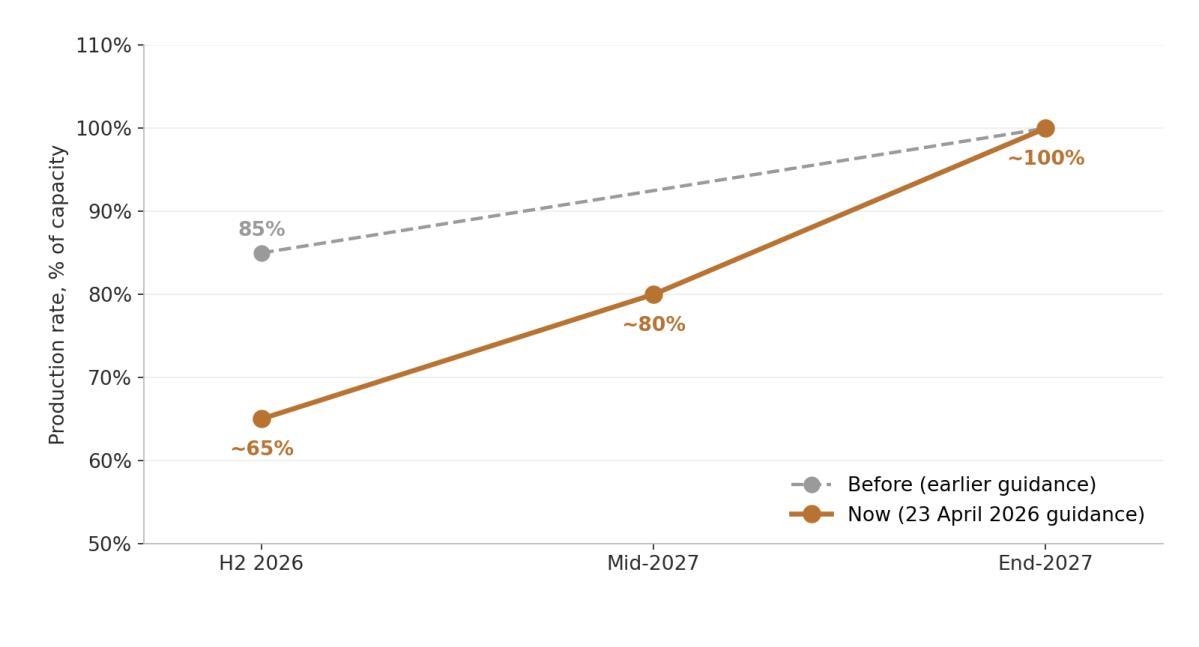
Mining restarted gradually from March 2026. Freeport expects its Indonesian operations to run at about 65% of normal in the second half of 2026, about 80% by mid-2027, and close to full capacity by the end of 2027. These are company targets, so the actual recovery still needs watching.
Figure 3. Grasberg’s recovery will take longer than first planned. Source: Freeport-McMoRan, first-quarter 2026 results, 23 April 2026 (SEC Form 8-K, Exhibit 99.1).
This entry is part of the members' archive. The full note continues for another eleven paragraphs, along with the underlying working and the spreadsheet built while reading through the filings.
It closes with the two questions worth putting to management on the next call, and what would have to change for the view to change with it.
Can Aditya Infotech keep growing sales rapidly while maintaining 14–15% EBITDA margins, expanding capacity before it becomes a bottleneck, and localising more of the camera bill of materials? Everything up to the IP vs analog section is open to everyone.
The core question
Can Aditya Infotech keep growing sales rapidly while maintaining 14–15% EBITDA margins, expanding capacity before it becomes a bottleneck, and localising more of the camera bill of materials?
Executive snapshot
So you might have seen the CP PLUS CCTV cameras at places. Yes, so that is the company we are discussing here.
Aditya Infotech is increasingly an own-brand surveillance product company rather than a pure distributor. CP PLUS was about 87% of revenue in Q1 FY27, and IP products were about 79% of the CP PLUS portfolio. The financial story is now a combination of high sales growth, a richer product mix, margin expansion, lower finance costs and an aggressive capacity and localisation programme.
Measure
Latest
Context
FY26 revenue
₹4,221 cr
+35.6% YoY
Q1 FY27 revenue
₹1,402 cr
+89.5% YoY
FY27 revenue guidance
₹6,000–6,500 cr
40–50%+ growth
FY27 EBITDA margin guidance
14–15%
Q1 FY27 was 14.8%
Current capacity
~2.5m units/month
~85–90% utilisation
Capex envelope discussed
~₹200–300 cr
Mostly internal accruals
The business model
Aditya Infotech sells security and surveillance products, mainly under its flagship CP PLUS brand. The company started as a technology distributor, entered video surveillance in 2007, and has progressively moved toward owning the brand, designing products, manufacturing locally and building its own R&D capabilities.
The simplest way to think about the business: component suppliers → AIL R&D and product design → Kadapa manufacturing → CP PLUS channel and customer.
The economic change is important: distributing somebody else's finished product gives Aditya Infotech a distributor margin. Designing, manufacturing and selling its own CP PLUS product allows the company to capture more of the product economics. Management has said the margin differential versus the legacy Dahua distribution model was almost 3x.
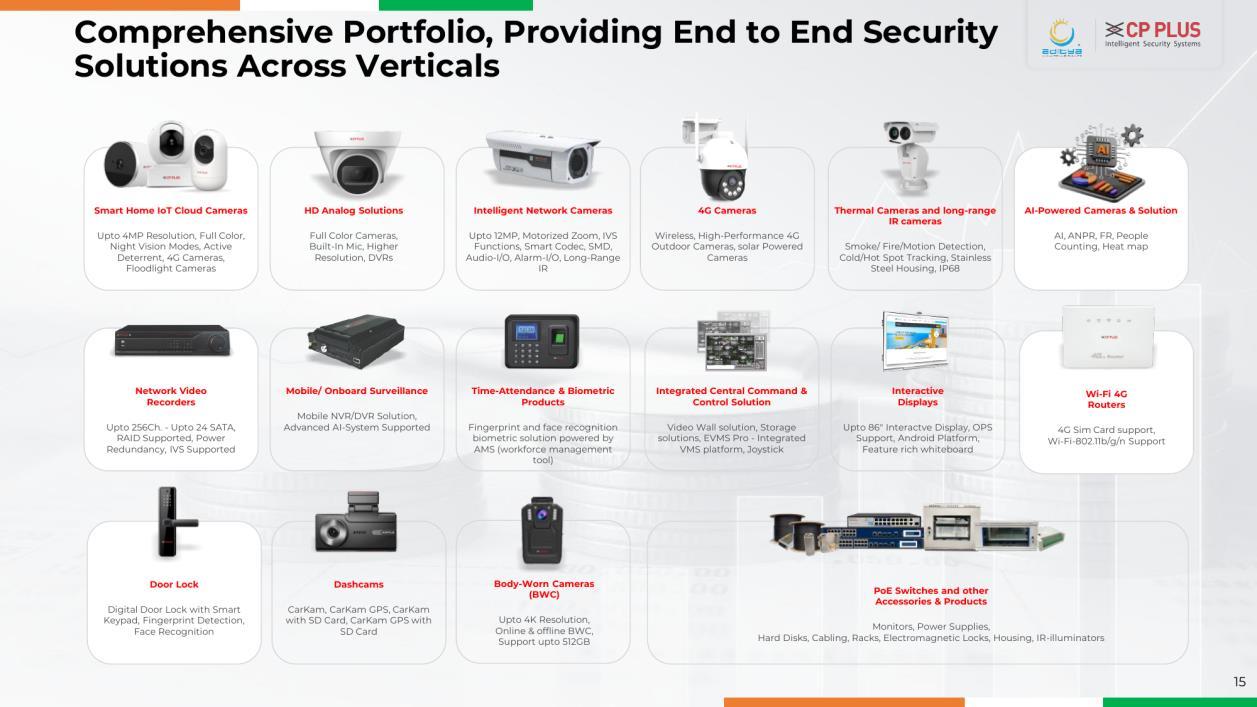
Comprehensive portfolio, providing end-to-end security solutions across verticals — the CP PLUS product range, from HD analog and IP cameras to NVRs, displays, door locks and accessories.
Who buys these products?
The company sells through a large channel network rather than directly bidding for every end-customer project. Its ecosystem includes 800+ distributors and 1,800+ system integrators across 500+ cities. End demand comes from homes, small and medium businesses, enterprises, industrial customers and government/public-infrastructure projects.
The business is not just "selling CCTV cameras". The important variables are brand mix, IP vs analog mix, average selling price, manufacturing scale, localisation of components, channel reach and the ability to add software/AI over time.
IP vs analog: why the mix matters
Management groups front-end cameras into three broad buckets: HD analog, IP cameras, and Wi-Fi/4G plug-and-play cameras. The important structural shift is from lower-value analog products toward higher-value IP products.
Camera type
Simple explanation
Management view
Economics
HD analog
Lower-cost camera on traditional CCTV infrastructure
Expected to remain broadly flat
ASP about 30% of an IP camera
IP camera
Networked digital camera, better control, scalability and AI capability
Expected to drive most of the growth
ASP roughly 3–3.5x analog
Wi-Fi / 4G
Plug-and-play cameras, homes and smaller installations
Some growth expected
Another higher-value connected category
By Q1 FY27, management said IP products were about 79% of the CP PLUS portfolio. CP PLUS itself was about 87% of total Aditya Infotech revenue. The company does not separately disclose the latest exact analog revenue share because the non-IP bucket also contains Wi-Fi/4G and other products.
This entry is part of the members' archive. The full note continues for another eleven paragraphs, along with the underlying working and the spreadsheet built while reading through the filings.
It closes with the two questions worth putting to management on the next call, and what would have to change for the view to change with it.
F2F (Forest to Flower) is my research membership on Indian markets: company deep dives, results analysis, sector and macro reads, audio notes, and answers to your own questions. Here is exactly what is inside, what it costs, and how to join.
Key metrics
Metric
Value
3 months
₹1,333 a month · one results season
₹3,999
6 months
₹1,166 a month · two results seasons
₹6,999
1 year
₹917 a month · four results seasons, best value
₹10,999
Why F2F exists
Good investment information is not the problem. Finding it inside all the noise is. Every quarter there are hundreds of results presentations, concalls and filings, and most of what gets written about them is headline-level.
F2F is the path I cut through that forest so you can find the flowers. I read the primary documents, do the work, and hand you what matters in whatever format the story needs. It is built to sharpen your own analysis and decisions, not replace them.
What is inside
1. Business analysis
How a company actually makes money, what drives its margins, and where the risks sit. Built from annual reports, filings and management commentary. Recent examples on the desk: Rossell Techsys, Shiprocket and Craftsman Automation.
2. Quarterly results analysis
Every results season, the numbers that matter: growth, margins, guidance, and what changed from last quarter. Not just whether a company beat estimates, but whether the story is still intact. The PB Fintech Q1 FY27 note is a good example.
3. Sector reads
How an industry works end to end: demand drivers, cost structure, competition, and which listed names are best placed. Recent ones cover Indian paints, pharma and aerospace.
4. Macro research
Rates, inflation, currency, credit and government spending, and what they mean for Indian sectors and earnings. The top-down context behind the company-level work.
5. Watchlist stocks
A running list of companies I am tracking closely, with the reason each one is on it and what would change my view. For research and learning, not a buy or sell recommendation.
The formats
Business updates: focused notes with a key-numbers table up top, so you get the picture in thirty seconds and the full reasoning if you want it.
Sector and macro reads: longer pieces, with charts and tables, for the topics that need space.
Audio notes: short recordings you can listen to on a commute. Once you are in, you get a private podcast link that works in Apple Podcasts, Pocket Casts or any podcast app.
Ask: send me a question on a company, sector or concept and I answer it on the desk.
Archive: everything published so far, searchable by format, from day one.
Who writes it
I am Dhruv Madia, a CFA Charterholder. I have cleared Macro Specialist Designation Level I and am currently appearing for Level II. I have four years of experience in macro research, sector research and macro data analytics, and have spent the last seven years studying equity markets.
Pricing
Every plan unlocks everything in full: the feed, the archive, the audio notes and the podcast link. The only difference is how long you are in.
3 months, ₹3,999: one results season, start to finish.
6 months, ₹6,999: two results seasons.
1 year, ₹10,999: four results seasons and every long read in between. Works out to ₹917 a month.
How to join
1. Hit Request access on the feed page and tell me which plan you want.
2. I reply by email with payment details and your personal access code.
3. Enter the code at Enter code, and the whole desk opens up.
No card details on the site, no checkout. Not ready yet? The first part of every note is free to read, and a few notes are open in full, so you can judge the work before you pay for it.
4 min read
Members only16 Sept
Jyoti CNC: An important company to watch out for in H2 2027
Jyoti CNC: An important company to watch out for in H2 2027.
This entry is part of the members' archive. The full note continues for another eleven paragraphs, along with the underlying working and the spreadsheet built while reading through the filings.
It closes with the two questions worth putting to management on the next call, and what would have to change for the view to change with it.
Rossell Techsys builds the wiring inside aircraft, satellites and chip-making machines. It went from a single-customer Boeing supplier to more than thirty customers, and FY26 sales rose 87% to ₹485 crore. The demand story holds up. The financial story does not yet: margin fell, operating cash flow was negative ₹81.6 crore, and the ₹300 crore equity raise is about nine months late. What the company makes is open to everyone.
In one paragraph
Rossell Techsys builds the electrical wiring assemblies that sit inside aircraft, satellites and semiconductor fabrication equipment. For fourteen years it was a single-customer Boeing supplier. It now has more than thirty customers and did ₹485 crore in sales in FY26, up 87%. The demand story is real and order-backed. The financial story is not there yet: EBITDA margin fell despite that scale, operating cash flow was negative ₹81.6 crore, and the ₹300 crore equity raise meant to fund the next leg has been pending for roughly nine months.
What the company actually makes
Let's understand what the company does in simple language. An aircraft has thousands of wires. They connect the radar, the screens in the cockpit, the weapons, the engines. You cannot just leave those wires loose inside. They would rub against each other and break. And no mechanic could ever find a fault in that mess. So a supplier makes them into one ready-made bundle.
Every wire cut to the right length. The whole thing wrapped in a protective cover. Plugs fixed on both ends. Every wire labelled so you know which is which. It ends up looking like a stiff tree of cable with branches. The mechanic just lifts it into the plane in one go and plugs it in. That is the product.
Now here is the important part. A satellite needs the same thing. So does a machine in a chip factory. Same wires, same plugs, same paperwork. Only the customer is different. That is how a company making Boeing harnesses ended up selling to satellite and chip companies without changing what it does.
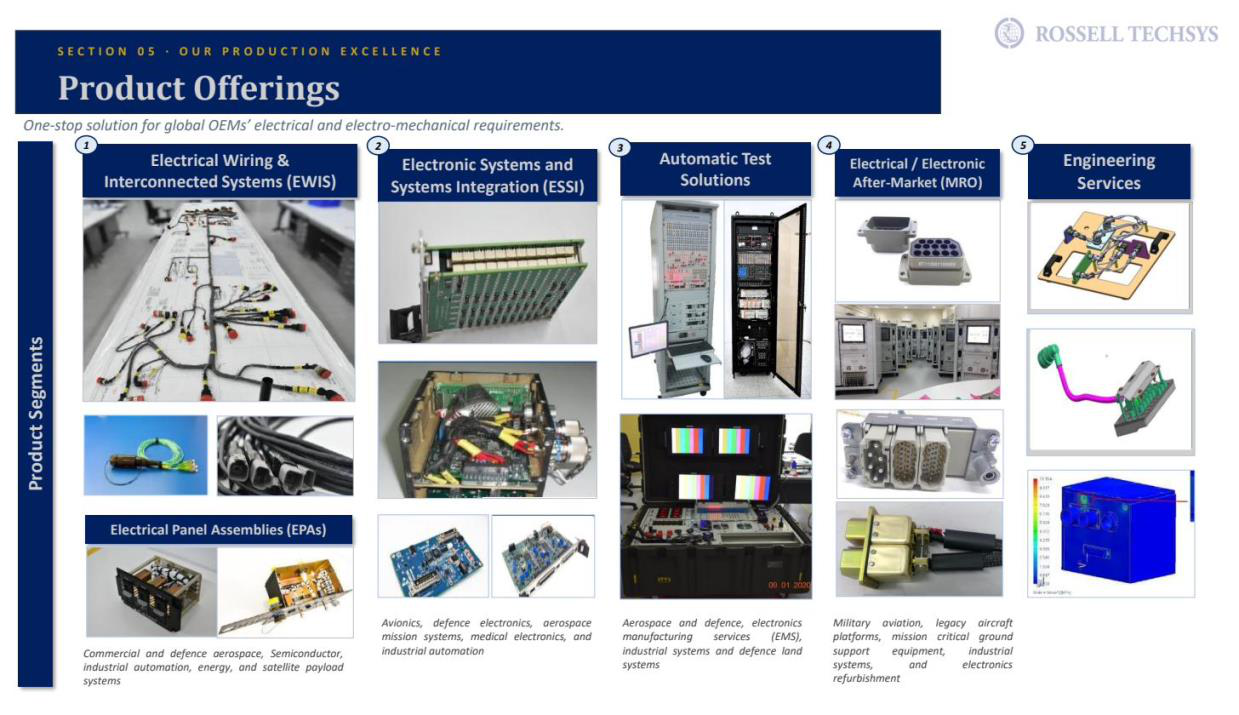
In aerospace this is called EWIS, Electrical Wiring and Interconnection Systems, and it is approximately 70% of Rossell's revenue. In simple language, it is the wiring harness systems for the different segments: aircraft, defence, semiconductor and space.
The remaining 30%
Four adjacent lines, all built on the same assembly and documentation discipline:
Electrical Panel Assemblies (EPA): a metal box with switches and safety devices already fitted and wired inside. It comes closed and tested. The customer just bolts it into the aircraft and connects two plugs.
Electronic Systems (ESSI): circuit boards with all the small parts fitted on them, then built into a finished working unit. These go into cockpit electronics, defence equipment and factory machines.
Automatic Test Solutions (ATE): a tall rack full of instruments. The customer plugs a part into it and it tells them pass or fail. Note where this one goes. It does not go into the aircraft. It stays in the customer's factory, used for checking parts before they are cleared to fly.
Engineering services and repair work (MRO): sometimes they help make the drawing instead of just following it. And they have now got the licences to do repair and servicing work on parts already in use, which is a new line for them.
Product offerings across the five lines. Source: Rossell Techsys Q1 FY2026-27 Investor Presentation, slide 20.
Two structural facts to hold onto
First, most of this is build-to-print work. The customer supplies the drawing and owns the intellectual property. Rossell is selling qualified, documented, defect-free assembly, not design. Some newer work is build-to-spec where IP is shared, but that is the minority.
Second, roughly 98 to 99% of revenue is exported, of which about 80% goes to North America and the balance to Europe, Israel and the Middle East. India is immaterial to the revenue line. This is an Indian cost base earning dollars.
This entry is part of the members' archive. The full note continues for another eleven paragraphs, along with the underlying working and the spreadsheet built while reading through the filings.
It closes with the two questions worth putting to management on the next call, and what would have to change for the view to change with it.
Everything you need to understand the industry, and how to read the September 2026 quarter when it lands. How the money actually moves from factory to wall, why the tinting machine is the only distribution number worth tracking, what Birla Opus has permanently taken away, and a company-by-company scorecard with the exact thresholds to check.
PART 1: HOW THIS INDUSTRY WORKS
Follow the money from the factory to your wall
You repaint your house every four to six years. That is the whole demand cycle of this industry in one sentence. Not when you build a house, when you repaint one. Hemant Jalan of Indigo Paints made this point directly on the February 2026 call, saying new construction accounts for a very small part of paint purchase and the major part is repainting.
This matters more than it sounds. It means paint demand does not track real estate. It tracks how people feel about spending money on their home, which is a much softer and more emotional thing.
Now follow the transaction. You decide to paint. In most cases you do not choose the product, your painter does, or he narrows it to two options. You or he goes to a dealer shop. You pick a shade from a card. The dealer takes a can of white base paint and mixes your shade into it on the spot.
Four parties, four different incentives:
The company makes the paint, sells it to the dealer at a list price, and spends heavily on advertising so you ask for its brand by name.
The dealer buys from the company and sells to you. He earns the difference. He also earns a second thing that matters enormously: a back-end rebate from the company, paid periodically based on how much he sells.
The painter is the actual decision maker in most households. Every company runs a loyalty programme for him. Kansai Nerolac's Pragati programme covered 65,000 painters in a single quarter. Birla Opus discloses roughly 4.5 lakh active contractors and painters.
You mostly choose a brand and a colour, and defer on the rest.
Two ways paint reaches you, and why the difference decides everything
This is the single most useful thing to understand about the industry, so it is worth going slowly.
Ready-made cans. Paint that already has colour in it. Made in the factory, shipped coloured, sits on a shelf. You buy it as it is. But only a handful of shades are worth making this way, mostly whites and a few popular colours. No company can manufacture two thousand different shades and ship them to thousands of shops.
Machine-mixed paint. This is how almost everything else is sold. The company ships plain white base paint to the shop. The shop has a tinting machine, which holds cartridges of concentrated colourant. You point at a shade on a card, the dealer keys the code into the machine, it injects exact quantities of colourant into the white base, and a shaker mixes it. Your colour gets made in front of you in about five minutes.
Why the tinting machine is the real competitive asset
Three facts, and the conclusion follows on its own.
One. The machine belongs to the paint company, not the dealer.
This entry is part of the members' archive. The full note continues for another eleven paragraphs, along with the underlying working and the spreadsheet built while reading through the filings.
It closes with the two questions worth putting to management on the next call, and what would have to change for the view to change with it.
Shiprocket: not a logistics company, and why that changes the answer
Shiprocket listed recently and is already sitting next to Delhivery, Shadowfax and Blue Dart on peer comparison tables. That is the wrong shelf. This piece walks the business from scratch — what it does, how it makes money, how big the opportunity is, and what Q1 FY27 actually showed. The business model section is open to everyone.
Shiprocket listed recently and is already sitting next to Delhivery, Shadowfax and Blue Dart on peer comparison tables. That is the wrong shelf. If you value it that way you will get the wrong answer.
This piece walks through the business from scratch: what it does, how it makes money, how big the opportunity is, what Q1 FY27 showed, what management said and did not say, and what to watch next quarter.
The business model
Shiprocket is not a logistics company. Delhivery, Shadowfax and Blue Dart are.
Think of Shiprocket as MakeMyTrip, and the other three as the airlines that list on it. MakeMyTrip does not own aeroplanes. It shows you the options, you pick one, the airline flies you.
Shiprocket does that for parcels and runs a platform. A seller logs in, enters the parcel weight and the destination pincode, and sees a list of couriers with prices and delivery times. He picks one. The courier collects the parcel from his doorstep and delivers it. Shiprocket never touches the parcel.
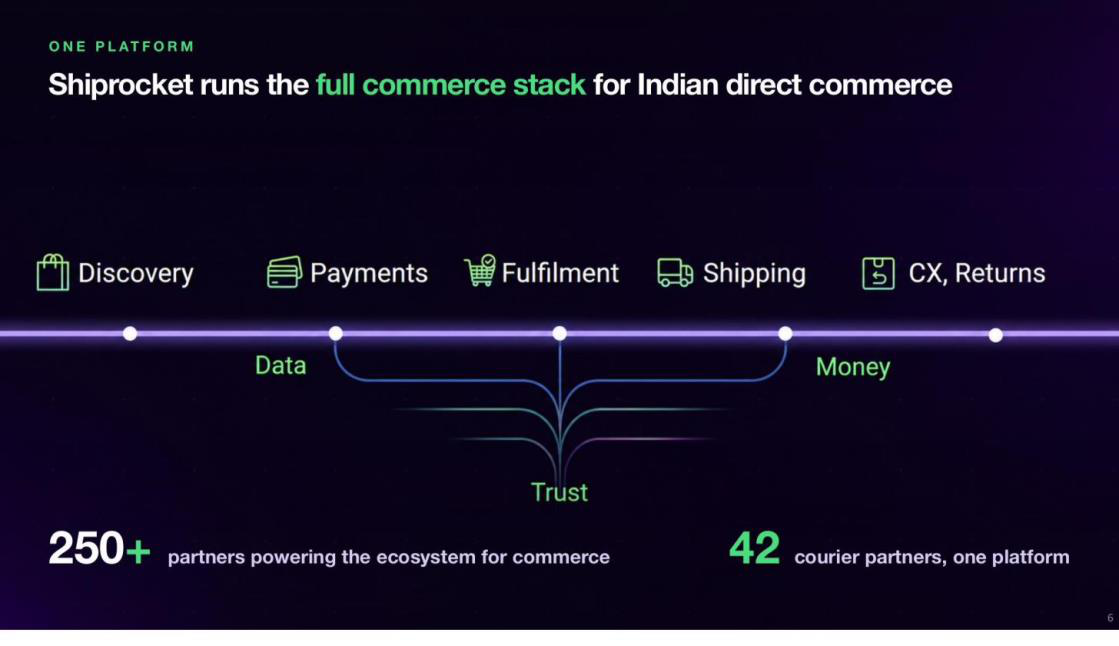
Shiprocket sits across the whole commerce stack — discovery, payments, fulfilment, shipping, returns — without owning any of it. 250+ ecosystem partners, 42 courier partners.
Two things make it more than a price comparison site.
It buys cheaper than you can. Shiprocket pushed 202 million shipments through 42 courier partners in FY26. That volume gets bulk contracts. A seller doing 50 orders a day would be quoted a far worse rate going to Delhivery directly. Shiprocket buys in bulk and resells at a price that is still better than what the small seller could get alone. The gap is its margin.
It takes responsibility for the mess. Missed pickup, disputed weight, refused cash on delivery, lost parcel. Normally the seller argues with the courier. Here Shiprocket sorts it out.
The company is blunt about the distinction. The annual report prints "Shiprocket is not a logistics company", and on the call the CEO described the model as doing all this without owning any of the assets.
You can see that in the balance sheet. Net fixed assets were ₹24.5 crore at 31 March 2026. Capex was 0.9% of revenue. Delhivery, by contrast, owns trucks, sorting hubs and thousands of crore of gross block.
This entry is part of the members' archive. The full note continues for another eleven paragraphs, along with the underlying working and the spreadsheet built while reading through the filings.
It closes with the two questions worth putting to management on the next call, and what would have to change for the view to change with it.
PB Fintech: the business model, and what Q1 FY27 actually told us
An explanation of how PB Fintech makes money and how it performed in Q1 FY27, judged on growth, margins, operating leverage and profit. It is not a valuation and not a recommendation. Part 1 — the business model — is open to everyone.
Part 1: The business model
You have definitely heard of Policybazaar. That is basically PB Fintech.
PB Fintech operates as a platform across two verticals: the core business and the new initiatives.
The core business (around 63% of revenue)
Policybazaar (about 57% of total revenue). PB Fintech runs a platform where you as a customer enter and choose from a variety of insurance policies. The premium goes to the insurance company. PB Fintech only earns something called a take rate (think of it as a commission from the insurer). That take rate is the revenue.
Paisabazaar (about 7% of total revenue). Same idea as above but for loans. Here, PB Fintech runs the platform for people who want loans. The disbursal goes to the lender and PB Fintech again earns a slice only.
The thing that actually makes Policybazaar work: renewals
This one idea explains most of the business, so understand it before anything else.
You buy a health policy in June 2025 for ₹20,000. In June 2026 the cover runs out, so you pay ₹20,000 again. That second payment is the renewal.
Both years earn PB a commission. But the cost of earning them is completely different.
Year 1 is expensive. Ads to bring you in, a call centre person spending forty minutes explaining two plans, three follow-ups before you buy. After all that, very little is left.
Year 2, PB does almost nothing. A reminder, a payment link, one call. Same commission, and this time PB keeps roughly 77-80 paise of every rupee.
And there is a lag. Renewals today come from policies sold two and three years ago. PB has grown fresh premium 35-48% for thirteen straight quarters, so the renewal book keeps getting bigger on its own, from business already written.
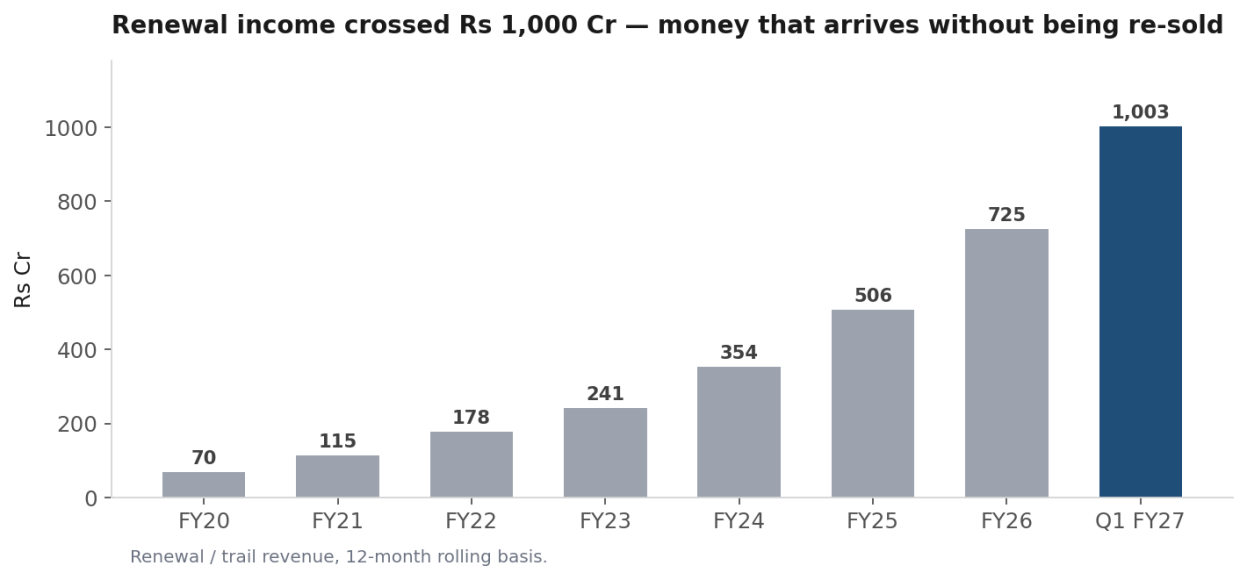
Here is management explaining exactly that on the Q1 FY27 call:
Renewal income crossed ₹1,000 crore — money that arrives without being re-sold. Renewal / trail revenue, 12-month rolling basis.
The new initiatives (the remaining 37% of revenue)
Four businesses sit here, and each one is the same platform idea pointed at a different customer.
PB Partners is the big one. Think Policybazaar but for the agents, not you. Policybazaar's app is for you. PB Partners' app is for the agent. Over 5 lakh agents sit on this platform and sell insurance to their own customers, mostly motor. The premium again goes to the insurance company, and PB Fintech earns a take rate on it, but here it has to share most of that with the agent. So the slice PB keeps is much thinner than Policybazaar.
Why do it then? Because a truck owner in a tier 4 town is never going to compare policies on a website. He calls the agent he has been using for ten years. PB Partners covers 99% of the pin codes in India, and 78% of its business now comes from tier 2 and tier 3 cities.
PB Connect is the same thing as PB Partners, but for loans instead of insurance.
PB for Business is Policybazaar for companies instead of individuals. Group health, group term, property and liability cover sold to employers. Over 21,000 corporates and SMEs.
PB UAE is simply Policybazaar run in Dubai. Same platform, different country. Profitable, and about half its book is now health and life rather than motor.
Why the margins look so different
The core business earns a 19% EBITDA margin in the quarter (21% rolling twelve months). New initiatives earn −5% EBITDA margin.
New initiatives contribution margin (think gross margin in simple language) was −60% in Mar-22 and is 7% now. But the EBITDA loss has stopped shrinking (covered more deeply in Part 4), because it is the one thing that went wrong this quarter.
One thing to know about the loan business
Inside credit, unsecured lending pays a higher take rate and secured lending pays a lower one.
A home loan is a huge ticket, so it makes the disbursal number look massive, but the fee on it is small. A personal loan or a credit card is a small ticket with a much better fee. So when you see disbursals jumping and PB's credit revenue flat or falling, that is the mix at work, not the business breaking.
That phase now looks over. Credit revenue has started growing again.
That is the whole business model. Once you have this in your head, the concalls make sense on their own.
This entry is part of the members' archive. The full note continues for another eleven paragraphs, along with the underlying working and the spreadsheet built while reading through the filings.
It closes with the two questions worth putting to management on the next call, and what would have to change for the view to change with it.
Two plants doing two different things. One owns its brands and its registrations but grows 7–8% a year; the other has gone from 21% to 45% of the company in two years but sells almost entirely under someone else's licence. Coverage through Q1 FY27, and the six numbers that decide whether the guidance holds.
This entry is part of the members' archive. The full note continues for another eleven paragraphs, along with the underlying working and the spreadsheet built while reading through the filings.
It closes with the two questions worth putting to management on the next call, and what would have to change for the view to change with it.
Walking through Sakar Healthcare out loud — the two plants, why profit is growing far faster than revenue, and why 16 approvals out of 178 submissions is the number that decides the FY27 guidance.
This entry is part of the members' archive. The full note continues for another eleven paragraphs, along with the underlying working and the spreadsheet built while reading through the filings.
It closes with the two questions worth putting to management on the next call, and what would have to change for the view to change with it.
Aequs is the Indian Tier-2 supplier that has spent close to two decades putting all four steps of aerospace manufacturing inside a single fence. This note walks through the business in full.
This entry is part of the members' archive. The full note continues for another eleven paragraphs, along with the underlying working and the spreadsheet built while reading through the filings.
It closes with the two questions worth putting to management on the next call, and what would have to change for the view to change with it.
Astra Microwave — why a big order book isn’t the same as revenue
Astra Microwave is another good example of what can happen in a business where execution matters more than just having a large order book and why only knowing about a macro theme isn’t enough.
This entry is part of the members' archive. The full note continues for another eleven paragraphs, along with the underlying working and the spreadsheet built while reading through the filings.
It closes with the two questions worth putting to management on the next call, and what would have to change for the view to change with it.
This entry is part of the members' archive. The full note continues for another eleven paragraphs, along with the underlying working and the spreadsheet built while reading through the filings.
It closes with the two questions worth putting to management on the next call, and what would have to change for the view to change with it.
Turtlemint has made big promises. Can it keep them?
First profitable quarter, revenue up 57%, Service EBITDA up 70%. All three numbers are real. The story underneath is not quite the one the headline tells.
This entry is part of the members' archive. The full note continues for another eleven paragraphs, along with the underlying working and the spreadsheet built while reading through the filings.
It closes with the two questions worth putting to management on the next call, and what would have to change for the view to change with it.
E2E Networks: the big rally, but what to track going forward
The stock has been rallying, and the reason is a genuinely great set of numbers. The point from here is not to go with the flow, but to understand what to track going forward.
This entry is part of the members' archive. The full note continues for another eleven paragraphs, along with the underlying working and the spreadsheet built while reading through the filings.
It closes with the two questions worth putting to management on the next call, and what would have to change for the view to change with it.
Gandhar Oil: two scenarios to watch that could make or break the thesis
Revenue up 92%, EBITDA up 512%, PAT up 689%. After a quarter like that, the question is not whether it was good — it is how much of it survives.
This entry is part of the members' archive. The full note continues for another eleven paragraphs, along with the underlying working and the spreadsheet built while reading through the filings.
It closes with the two questions worth putting to management on the next call, and what would have to change for the view to change with it.
India’s listed broking platforms after Q1 FY27: Groww vs Angel One
Billionbrains Garage Ventures (Groww) and Angel One both reported Q1 FY27 in mid-July. One grew revenue 66%, the other 25%. That gap is the story.
Setting up the story
Q1 FY27 was calm after a brutal Q4 FY26. The war-driven volatility that inflated derivatives volumes in Q4 faded, and with it trading activity declined. According to NSE data, NSE active clients declined by roughly 257,000 for the industry in Q1 FY27. New demat additions at the depositories were soft. Both managements said July began weak, and both declined to extrapolate the next fifteen days.
As we know, this is a sector where regulations can have a big impact.
First, the RBI has introduced rules around how much banks can lend to capital-market businesses, which could make it harder for brokers to access short-term funding. However, Angel One's CFO said the impact should be limited because it relies on multiple sources of funding, including NBFCs, NCDs and commercial paper.
Second, there was a report during the results season that margin requirements for trading on expiry days could increase. Groww's CFO said this was news to the company as well, and that they had not seen any clear impact from the earlier increase in the additional margin requirement.
So neither company appears particularly worried at this point. But regulations are still something they cannot ignore. At least half of both companies' revenue is linked, either directly or through interest income, to trading activity. Any major change that affects trading volumes could therefore have an impact.
Groww: how the machine works
Billionbrains Garage Ventures is the listed holding company. It does almost nothing itself except own things and run the broking book. The pieces that matter:
Groww Invest Tech, the broking arm — stocks, equity derivatives, commodity derivatives and the Margin Trading Facility book.
Groww Creditserv Technology, the in-house NBFC — personal loans and Loans Against Securities on own balance sheet.
Groww Asset Management plus Groww Trustee. State Street Global Advisors has agreed to put in up to ₹580 crore for a 22.94% economic interest, and now has both CCI and SEBI clearance.
Finwizard Technology (Fisdom), the wealth business bought for ₹961 crore in October 2025.
Assorted others: Groww Pay, Groww Insurance Broking, and Groww IFSC, the GIFT City entity that will house US stocks.
Sixteen entities in the consolidation as of 31 March 2026. One reportable segment, because management tells the board it runs the whole thing as one platform.
You download the app for a free mutual fund SIP. Groww earns nothing on it, because it sells direct mutual fund plans that pay no commission. What Groww has won is your presence: your money now lives on its platform. From there:
You buy stocks, and pay brokerage on every order.
You try equity derivatives — contracts that let you bet on where a stock or index will go, using far less money than buying the shares outright. Groww charges a flat ₹20 per order. Because derivative traders place many orders, this is the biggest fee pool in Indian broking, and also the one regulators worry about most, since most retail traders lose money in it.
You take a Margin Trading Facility loan: you buy more shares than your own cash would allow, Groww lends you the difference, keeps the shares as collateral, and charges 14.95% interest. Groww earns interest on the loan and brokerage on the larger trade.
Your idle cash earns Groww float income — interest on customer money parked overnight.
Groww's in-house lending company gives you a personal loan, or a Loan Against Securities where you pledge mutual funds or shares and borrow against them without selling anything.
One customer, four streams: fees, loan interest, float interest, and distribution income. The magic is that Groww's costs barely rise when you do more. About 90% of its costs are fixed, and the whole platform runs on roughly 1,350 employees. So when revenue grows, most of it drops straight into profit.
Groww's product mix, and how it moved
Share of total income
Q1 FY26
Q4 FY26
Q1 FY27
What it tells you
Equity derivatives
56.4%
54.8%
52.0%
Still more than half the business, but shrinking as a share
Stocks
19.3%
16.4%
16.4%
Steady; stock trading volumes grew 48% YoY
MTF (lending to buy stocks)
3.0%
6.9%
8.0%
The fastest riser; the loan book grew 264% in a year to ₹3,775 crore
Float (interest on idle cash)
9.9%
7.6%
8.1%
Stable and quietly valuable
Commodity derivatives
~0%
4.5%
4.9%
Did not exist before Sep 2025; already 28.6% retail market share
A year ago Groww was mostly a derivatives shop with a mutual fund funnel attached. It is turning itself into a diversified platform where lending and new products do more of the work. The change is real. But be careful with percentages: even though the derivatives share fell, derivatives still supplied about 45% of the extra rupees Groww earned this year, because the whole pie grew.
Groww's Q1 FY27 numbers
Total income ₹1,549 crore, up 63% YoY and up about 1% from Q4. EBITDA up 100% to ₹971 crore at a 64.7% margin. Profit after tax ₹735 crore, up 94%.
Total income was flat QoQ mainly because Q4 was exceptional — war-driven volatility made people trade more, and management called that quarter an anomaly on the call. Even though revenue stayed flat, the quality of that revenue improved. The market was relatively calm, yet the company maintained revenue by replacing some of the more volatile derivatives income with steadier income from MTF and commodities.
Groww added 115,000 net active NSE clients during the quarter, even as the industry as a whole lost 257,000. New customer additions were weak, so this growth appears to have come mainly from existing Groww customers continuing to stay active while customers on other platforms became inactive. In a business where retaining customers is one of the hardest things to achieve, that is a meaningful advantage.
The cost structure tells an equally important story. Revenue grew 63% YoY, while the company's largest cost bucket, largely employee costs, increased by just 2.4%. That is the operating leverage in the model.
Groww's three soft spots
One: Fisdom. Groww acquired the wealth-management business in October 2025 for ₹961 crore. Of this, ₹920 crore was goodwill — the amount paid above the value of Fisdom's identifiable assets, because it believed the business had significant future potential. But nine months later, Fisdom's revenue has actually declined. Asked whether the expected improvement had started to show, the CFO's answer was clear: "No. We haven't yet seen the significant improvement."
Two: net inflows. This is the purest health metric Groww reports — fresh money customers put in, minus money they took out, ignoring market movements entirely. It has fallen three quarters running: ₹26,000 crore, then ₹25,000 crore, then ₹23,000 crore. Total customer assets still grew 22% in the quarter, but mostly because markets went up, not because more money came in.
Three: the base effect. Groww grew 66% this quarter because the year-ago quarter was small. It is always important to see which base the current results are being compared against.
What Groww's concall said about the future
The CEO's framing is simple: Groww's first ten years were about giving people access to financial products. The next decade is about becoming a true wealth management company.
The company is building several products to support that ambition. It plans to launch US stock investing through its GIFT City licence, which has been approved and is currently being tested, with launch expected in the next few months. It is also working on W, a wealth product; MF Prime, an AI-led mutual fund advisory platform; and a bond offering. The AMC has received approval for State Street Global Advisors to acquire around 23% for approximately ₹580 crore.
On MTF, management expects the loan book to grow by ₹600 to ₹700 crore every quarter, assuming market conditions remain supportive. On costs, fixed costs are expected to grow by 10% to 20% annually, while revenue is expected to grow faster.
Angel One: how the machine works
Angel One is a thirty-year-old broker that rebuilt itself as an app, and it runs the same basic structure as Groww with two structural differences.
Share of gross revenue, Q1 FY27
Share
What is happening to it
F&O brokerage
45%
The core engine. Recovered strongly through FY26 after the SEBI crackdown; volumes dipped again this quarter with the market
Interest income
33%
The growth engine. Client funding book hit a record ₹7,152 crore, up 31% in one quarter
Cash equity brokerage
9%
Small but improving: revenue per order rose from about ₹15–16 to ₹19 on a pricing change and a paid value-added plan
Commodity brokerage
6%
Growing with the market; Angel holds roughly half of retail commodity turnover
Depository, distribution and other
7%
Distribution fell this quarter on seasonally weak insurance and lower credit disbursals
Interest income has two sources: interest on the client funding book, which is Angel's version of MTF plus funded receivables; and interest on the deposits Angel must park with exchanges as security.
Then there are the younger businesses, still too small to contribute meaningfully.
Ionic Wealth, a wealth manager for the rich: AUM stood at ₹13,440 crore, up 33% in one quarter. Around 91% is ARR AUM, meaning the assets generate recurring annual fees rather than a one-time commission — the more attractive kind of revenue, because it repeats. Management expects breakeven in three to four years.
Credit distribution: Angel arranged ₹530 crore of loans during the quarter, up 130% YoY. However, the number has declined for three consecutive quarters, from ₹710 crore to ₹610 crore and now ₹530 crore. Management attributed this to lenders recalibrating and some friction in the customer funnel, but said it does not expect further deterioration.
AMC: after 15 months, the business has ₹620 crore of assets. Clearly still a work in progress. Management said the strategy should become clearer over the next three to four quarters, while there has also been churn in the senior team.
LAS on its own books: Angel is piloting lending against securities through its own NBFC, and expects it to become meaningful over the next two to three quarters. The company is investing ₹150 crore into it, along with another ₹150 crore into the wealth business.
Angel One's core business is still the mature trading business, which moves with market activity. MTF is becoming a second growth engine and is scaling well. Wealth, credit distribution and the AMC are still early-stage bets.
Angel One's Q1 FY27 numbers
Gross revenue ₹1,434 crore, up 25.4% YoY, down 2.3% from Q4. Reported EBDAT, basically EBITDA, ₹360 crore, up 85% YoY, at a 32.7% margin. Profit after tax ₹231 crore, up 102% YoY but down 28% from Q4.
Both of those dramatic percentages mislead, in opposite directions.
The 102% profit growth looks heroic only because the year-ago quarter was Angel's worst in years, the bottom of the slump after SEBI's derivatives restrictions. Remember FY26 as a whole: Angel's revenue fell 1.8% and profit fell 22% to ₹915 crore. Q1 FY27 is a recovery quarter, not growth.
The 28% profit decline versus Q4 looks alarming but is mostly seasonal. This quarter carried two months of IPL sponsorship spend — Angel's big annual brand outlay, roughly ₹150 crore per season — against only a few weeks in Q4, plus annual salary increments and fresh employee stock grants. Strip the seasonal items and Angel's normalised EBDAT margin, its own cleaned-up measure, was 43.6% versus 44.4% in Q4. A dip of less than one percentage point. That is the real number, and it sits comfortably inside management's guidance of a 45% to 50% margin for the core broking and distribution business, which the CEO reaffirmed on the call.
The cost story deserves respect too: total employee cost is guided flat at about ₹1,100 crore for FY27, the same as FY26, even after increments, because headcount fell roughly 20% during FY26 — from 4,139 to about 3,300 — with AI absorbing the work.
Angel One's soft spots
Market share is flat: 20.2% of overall retail equity turnover, down 17bps in the quarter, and an analyst put it to management directly that growth is coming from the market rising rather than Angel taking share. NSE active clients declined. Credit distribution has fallen three straight quarters against repeated assurances.
And a retail customer used the earnings call itself to complain about a restrictive stock policy that pushed part of his portfolio to a competitor. The CEO handled it with grace and gave out his own email address, but the exchange tells you where the product experience sits against the digital-native rivals.
What Angel One's concall said about the future
Margin guidance of 45% to 50% on the core business intact, with margin expansion expected beyond that as revenue grows against a flat cost base. Employee costs flat for the year. The new-business burn of 4% of margin this quarter guided to settle at 3% to 3.5% for the full year. Wealth breakeven in three to four years, with management willing to invest more if growth justifies it. LAS scaling within two to three quarters. US stocks via GIFT City here too. And a candid promise of an AMC strategy reveal within three to four quarters.
What to watch
For the sector
Any SEBI move on expiry-day or derivatives margins. The one variable that can reprice both stocks in a day.
Industry NSE active client additions turning positive. Until the industry stops shrinking, everyone's growth engine idles.
For Groww
Net inflows. ₹23,000 crore and falling for three quarters. A fourth decline is a warning this company can give.
MTF book additions against the ₹600 to ₹700 crore per quarter guidance.
The main cost line staying near ₹170 crore a quarter. Above roughly ₹190 crore without explanation, and the margin story cracks.
Fisdom plus AMC revenue, about ₹28 crore this quarter and falling. Against ₹1,400 crore of goodwill on the books, it must turn up.
For Angel One
Normalised margin holding 45% to 50% in Q2 and Q3, which have no IPL excuse.
Credit distribution. Three straight declines against a promise of no more. Q2 tests the promise.
Market share. 20.2% and flat. Watch if growth stays purely market-driven while Groww takes share.
The ₹1,100 crore employee cost line staying flat.
LAS scaling and the promised AMC strategy reveal within three to four quarters.
Which one is fundamentally stronger
On the numbers and the guidance: Groww. It added customers while the industry lost them, which is the single hardest thing to do in this business. Its diversification shows up in the reported mix, not just the strategy slides. And its guidance was specific and checkable: loan book adds per quarter, cost trajectory, launch sequence. But the key risk is that Groww carries 52% of income in the most regulated product in Indian finance.
Angel One is the lower-quality machine with the lower-risk setup. It has already survived the regulatory shock Groww has not yet faced at scale; FY26's 22% profit decline is behind it, not ahead. It pays a dividend, guides costs in hard rupees, runs a larger lending book with a proven risk framework, and owns a human distribution network that grows more valuable as the sector pivots to wealth. What it lacks is what Groww has in abundance: organic pull. Flat market share, shrinking active clients and a three-quarter slide in credit distribution say Angel's flywheel needs the market's help to spin.
14 min read
Members only04 Sept · post-results
Syrma SGS: building India’s PCB independence
India imports nearly 80% of its PCB value chain. Syrma is one of the few companies actually trying to close that gap — and Q1 FY27 shows where the story really stands.
This entry is part of the members' archive. The full note continues for another eleven paragraphs, along with the underlying working and the spreadsheet built while reading through the filings.
It closes with the two questions worth putting to management on the next call, and what would have to change for the view to change with it.
Indo-MIM: strong numbers, but FY26 raises important questions
A newly listed company where the core is now the thing to track. Revenue grew 26%, but more than half the increment came from a loosely defined segment nobody has broken out.
Key metrics
Metric
Value
FY26 revenue
+25.9% YoY
₹4,193 crore
FY26 EBITDA
+14.8%; margin 25.5%, down ~247bps
₹1,071 crore
FY26 PAT
+26%, helped by ₹128 crore of other income
₹534 crore
Return on capital employed
up from 23.5% in FY25
26.6%
Operating cash flow
against ₹506 crore in FY25
₹1,077 crore
Capex
against PAT of ₹534 crore
₹417 crore
Repeat customers
largest customer only 8%; 1,100+ customers
91.6% of revenue
Export share
down from ~90% as domestic revenue nearly tripled
77%
Product types manufactured
across 15 facilities in India, US, UK and Mexico
9,000+
Indo-MIM listed on 30 July 2026 and has already risen 7% at the time of writing. So it now becomes interesting to read this company and keep tracking the key elements that may make or break the story.
The model in short
Indo-MIM manufactures small, complex and highly precise metal components that go inside larger products such as cars, surgical instruments, aircraft systems, firearms, mobile phones and industrial equipment.
The customer designs the final product while Indo-MIM manufactures the tiny metal components inside it. The difficult part is not making one component — the complexity lies in manufacturing millions of identical components while maintaining the exact same dimensions, strength and quality every single time. That is where Indo-MIM has built its expertise.
For example, a medical-device company may need a cartridge base for a surgical stapler. It gives Indo-MIM the required design and specifications. Indo-MIM develops the mould, manufactures samples, gets the part approved and then supplies lakhs of identical components. The customer pays for every finished component supplied.
So Indo-MIM is not selling machines or raw metal. It is selling a custom-made, ready-to-use metal component. The company manufactured more than 9,000 product types in FY26 and operates 15 manufacturing facilities across India, the US, the UK and Mexico.
What is MIM, and why is it useful?
Indo-MIM originally built its business around Metal Injection Moulding, or MIM. In simple terms, MIM allows a company to manufacture small and complicated metal parts using a mould.
Without MIM, the component may have to be cut out of a metal block through several machining steps. That can be costly and wasteful when millions of small parts are required. Once the mould is ready, Indo-MIM can manufacture the same complicated component repeatedly and at scale.
MIM remains the main business, but Indo-MIM has also added casting, machining, ceramic components, metal 3D printing, powder manufacturing, finishing and assembly. It is no longer only a MIM manufacturer — it is becoming a broader precision metal-component manufacturing company.
According to the Frost & Sullivan report commissioned by Indo-MIM, the company had an estimated 6.8% share of the global MIM market and FY26 MIM revenue of approximately ₹2,454 crore, around 58.5% of total revenue. These are estimates from a company-commissioned industry report, not independently audited market-share figures.
Why customers stay for years
Before mass production starts, Indo-MIM must develop a mould specifically for the component, manufacture samples, pass the customer's tests and factory inspections, and prove that every piece meets the required quality. This process can take two to three years.
Once approved, changing the supplier is difficult. The customer may have to develop a new mould, repeat testing and approve the component all over again. That creates switching costs and makes customer relationships sticky.
This is visible in the numbers: repeat customers generated 91.6% of FY26 revenue; the largest customer contributed only 8%; the top ten contributed 38.4%; and Indo-MIM served more than 1,100 customers.
The company added 308 customers during FY26, but they contributed only 8.4% of revenue. New customers usually start small, while most revenue comes from older customers whose products have already entered mass production.
Revenue is diversified across industries
Indo-MIM generated ₹4,193 crore of revenue in FY26, up 26% YoY. These are the company's internal product-group abbreviations:
APG — Automotive Products Group: components used in vehicle safety, fuel systems, powertrains and interiors.
DPG — Defence Products Group: firearm components such as triggers, hammers and sights.
MPG — Medical Products Group: components used in endoscopy, laparoscopy, dental robotics and orthopaedics.
CPG — Consumer Products Group: components for mobile phones, tools, hardware and fashion accessories.
Others — metal powder, tools and traded products.
End-use industry
FY26 (₹ mn)
FY26 share
FY25 (₹ mn)
FY25 share
FY24 share
APG
10,317.93
24.61%
9,591.92
28.81%
30.42%
CPG
4,530.34
10.80%
3,253.76
9.77%
9.57%
DPG
7,836.82
18.69%
8,923.09
26.80%
27.34%
MPG
7,579.82
18.08%
5,773.04
17.34%
19.58%
Aerospace
5,014.81
11.96%
3,762.75
11.30%
9.82%
Others
6,650.13
15.86%
1,991.21
5.98%
3.27%
Total
41,929.85
100.00%
33,295.77
100.00%
100.00%
Notice one big thing: most of the FY26 revenue boost came from "Others", which grew more than 200%.
What exactly happened in "Others"?
Indo-MIM's overall revenue increased by ₹863 crore in FY26, or 26% YoY. Here is how each segment contributed to that net increase:
Segment
Change in revenue
Contribution to total revenue growth
Others
+₹466 crore
54.0%
Medical
+₹181 crore
21.0%
Consumer
+₹128 crore
14.8%
Aerospace
+₹125 crore
14.5%
Automotive
+₹73 crore
8.5%
Defence
−₹109 crore
−12.6%
So around 54% of Indo-MIM's entire incremental FY26 revenue came from "Others". This category includes three very different types of revenue: metal powder, tooling, and traded products. These may not have similar margins or business quality.
Metal-powder manufacturing could be a strategically attractive backward-integration opportunity. Tooling revenue may indicate new customer programmes that later generate recurring component sales. Traded-product revenue, on the other hand, may involve lower manufacturing value addition and potentially lower margins.
The prospectus does not provide a separate revenue or profitability breakdown for these three activities.
Medical and aerospace are becoming more important
Medical revenue increased approximately 31% from ₹577 crore to ₹758 crore. Medical components generally have strict qualification requirements, long validation periods, significant quality requirements, and potentially long customer relationships. Indo-MIM's acquisition of Phoenix DeVentures also gives it medical-device design and development capabilities, which could allow it to enter earlier in the customer's product-development cycle rather than participating only at the manufacturing stage.
Aerospace revenue increased approximately 33% from ₹376 crore to ₹501 crore. Aerospace also has high qualification barriers and long product cycles. Once a component is approved for an aircraft platform or engine programme, the associated revenue can potentially remain sticky for several years.
Medical and aerospace together contributed approximately 30% of FY26 revenue, compared with around 29% in FY25 and 29% in FY24. The shares have not moved dramatically, but both are growing faster than automotive.
Defence weakened sharply
Defence revenue declined approximately 12% from ₹892 crore in FY25 to ₹784 crore in FY26. Its revenue share fell from 27.3% in FY24, to 26.8% in FY25, to 18.7% in FY26.
This is not merely a mix effect. Absolute defence revenue also declined.
The prospectus does not provide a detailed explanation for the fall. Defence orders can be programme-driven and uneven, so one year of weakness may not necessarily indicate a structural problem. But considering defence was previously one of Indo-MIM's largest segments, management needs to explain whether the decline was due to customer destocking, programme delays, demand weakness, shipment timing, customer-specific issues, or the loss of any programme.
A recovery in defence will be one of the most important things to monitor in next quarter's results.
The company remains export-oriented
Approximately 77% of FY26 revenue came from outside India, down from almost 90% in FY25. However, this does not mean export revenue declined. Overseas revenue increased from approximately ₹2,994 crore to ₹3,237 crore, growth of around 8%. The export share fell because domestic revenue almost tripled from ₹336 crore to ₹956 crore — and once again, most of the domestic increase came from "Others".
There is another interesting data point. Indo-MIM exported more than 250 million components in FY24, more than 300 million in FY25, but only more than 210 million in FY26. Export volumes declined substantially even though export revenue increased.
This could mean the company shifted towards fewer but higher-value components, which would be positive. But it could also mean weakness in certain high-volume programmes, partly offset by pricing, currency or product-mix benefits. So exports and their breakup become another key element to track.
The financial performance is strong
KPI
FY26
FY25
FY24
Revenue from operations (₹ mn)
41,929.85
33,295.77
28,703.95
Revenue growth
25.93%
16.00%
6.60%
EBITDA (₹ mn)
10,709.23
9,325.97
7,434.62
EBITDA margin
25.54%
28.01%
25.90%
PAT (₹ mn)
5,335.43
4,237.34
2,837.34
PAT margin
12.72%
12.73%
9.88%
Return on equity
21.26%
19.94%
14.01%
Return on capital employed
26.60%
23.51%
19.59%
Net debt to EBITDA
0.65
1.15
1.15
Revenue compounded at approximately 21% between FY24 and FY26, while PAT compounded at approximately 37%. The absolute margin profile is excellent for a manufacturing business, and ROCE improving from 19.6% to 26.6% despite regular capital expenditure is another positive sign.
But FY26 did not produce operating leverage
FY25 was an excellent operating-leverage year: revenue grew 16%, while EBITDA grew 25% and PAT grew 49%. EBITDA margin expanded from 25.9% to 28%.
FY26 was different. Revenue grew 25.9%, but EBITDA grew only 14.8%. EBITDA margin declined by approximately 247 basis points to 25.5%. The major expense movements help explain this — particularly higher cost of goods and employee expenses.
It does not mean Indo-MIM's margins are weak. A 25.5% EBITDA margin remains excellent. But the key question has changed from "can this company earn strong margins?" to "can it sustain those margins while growing outside its core MIM business?"
PAT growth was supported by other income
Indo-MIM's PAT increased approximately 26% to ₹534 crore. However, other income increased from ₹44 crore to ₹128 crore, primarily driven by approximately ₹80 crore of net foreign-exchange gains and approximately ₹37 crore of compensation received from customers following contract cancellations.
Customer compensation and currency gains should not be treated as core recurring operating income. At the same time, finance costs increased from approximately ₹96 crore to ₹167 crore. So PAT grew strongly, but the path was not entirely clean.
Cash flow was strong
Cash flow from operations increased sharply to approximately ₹1,077 crore in FY26, compared with ₹506 crore in FY25. Cash expenditure on property, plant, equipment and intangible assets was approximately ₹417 crore — a strong number compared with PAT of ₹534 crore.
However, FY26 cash flow received support from a reduction in other current and non-current assets, favourable movements in financial liabilities, and the add-back of non-cash impairment charges. So ₹1,077 crore should not automatically be considered the recurring annual cash-flow base.
The underlying working-capital movements were still encouraging. Inventory was broadly flat at approximately ₹895 crore despite revenue growing 26%. Trade receivables increased approximately 19%, slower than revenue growth of 26%, indicating collections broadly kept pace.
So the company is cash-flow positive and free-cash-flow positive. Inventory is nothing to worry about and receivables show timely payments.
Capex plans
Indo-MIM is establishing an iron-powder manufacturing facility in Karnataka, targeted for completion by the end of FY27. The company already manufactures stainless-steel powder. Iron-powder manufacturing could reduce dependence on external suppliers, improve supply security, expand material options and possibly increase internal value addition. But the project's capital requirement, expected revenue and expected return on capital have not been disclosed.
An under-construction facility in Tamil Nadu is intended to house a new tool-room and machining unit. The company had also deployed 436 robots and 476 IoT-enabled machines by March 2026, and intends to keep investing in automation, productivity and capacity utilisation.
The direction is positive, but upcoming quarters should demonstrate that new capacity generates revenue and returns rather than simply increasing depreciation and fixed costs.
Capital allocation is the biggest non-operating concern
Indo-MIM's core manufacturing business appears strong, but its overseas acquisition record has been less successful.
The company acquired Triax in the US and CMG Technologies in the UK to add new manufacturing capabilities and expand its geographical presence. However, both businesses subsequently performed below the expectations used at the time of acquisition. As a result, Indo-MIM has repeatedly reduced their value in its accounts through impairment charges.
An impairment does not mean fresh cash was lost during that particular year — the cash was spent when the business was originally acquired. It means the company now believes the acquired business is worth less than previously estimated.
Phoenix DeVentures, its latest US acquisition, is therefore important to track. Its medical-device design capabilities could help win more medical business, but investors should watch whether it produces meaningful revenue, profits and cash flow. Any further overseas acquisition should be examined carefully — particularly the purchase price, profitability of the target and the returns Indo-MIM expects to generate.
What I want to see next
Indo-MIM has already proved that it can grow profitably. The key now is understanding the quality and sustainability of that growth.
What
Why it matters
Growth from the core business
FY26 revenue grew strongly, but more than half the incremental revenue came from the loosely defined "Others" segment. I would like to see growth increasingly driven by core precision-component businesses
More clarity on "Others"
Management needs to explain how much comes from metal powder, tooling and traded products — and whether the segment earns margins comparable to the core
Operating leverage returning
Revenue grew faster than EBITDA in FY26 and margins fell from 28.0% to 25.5%. As utilisation improves, EBITDA growth should once again outpace revenue
Margin recovery through better mix
Operating leverage alone may not be enough. Improvement should also come from complex, value-added products in medical, aerospace and other high-precision applications
Clarity on capex and revenue conversion
How much capex is maintenance versus growth, when new capacity becomes operational, and how much revenue and return on capital it can generate
Export growth and domestic mix
A falling export share is not necessarily negative if domestic revenue grows faster at healthy margins. Focus on absolute export growth, volumes, realisations and the profitability of domestic growth
Better performance from acquisitions
Triax and CMG have already required impairments. Phoenix DeVentures must demonstrate it can generate revenue, profits, cash and additional medical opportunities
13 min read
Business update04 Sept · post-results
Electronics Mart India: strong Q1, but the real story starts now
The stock jumped after a blockbuster quarter. The bigger question is how to track this going forward — starting with the base it was measured against.
Key metrics
Metric
Value
Q1 FY27 revenue
+39% YoY
₹2,419 crore
Q1 FY27 EBITDA
+118% YoY; 9.9% margin
₹239 crore
Q1 FY27 PAT
+458% YoY
₹121 crore
Same-store sales growth
against a very weak base quarter
34.2%
Gross margin
up from 14.6%
17.2%
Pre-Ind AS 116 EBITDA margin
the margin that has actually paid the rent
8.3%
Bill cuts
against average ticket size +2% — volume-led growth
+36%
Store count
220 multi-brand, 7 exclusive brand, 100+ cities
227
NCR store-level EBITDA margin
against a 2.5–3% FY27 target; South was 10.9%
4.9%
Electronics Mart India was up around 9% on 10 August. The trigger was not subtle.
Q1 FY27 revenue grew 39% to ₹2,419 crore. EBITDA grew 118% to ₹239 crore. PAT grew 458% to ₹121 crore. Same-store sales growth came in at 34.2%. Gross margin went from 14.6% to 17.2%, and EBITDA margin from 6.3% to 9.9%.
So a combination of strong revenue growth, operating leverage and margin expansion triggered the move.
There is one number in that release I liked more than any of those. Bill cuts — the number of transactions invoiced — grew 36%. Average ticket size grew 2%.
That distinction matters more than it looks. If sales were rising mainly because prices had gone up, average ticket size would be doing the work. It is not. The number of transactions rose 36%. That is volume-led growth.
So the quarter was real. But before anyone annualises it, there is a piece of context that changes how you read every percentage in that release.
The base was a hole
In H1 FY26, same-store sales growth was reported at minus 4.8%. In Q2 FY26 alone it was plus 11.4%.
For a half year to average minus 4.8% when the second quarter was plus 11.4%, the first quarter has to have been very sharply negative. That is arithmetic, not opinion.
And management described that period themselves. On the Q3 FY26 call in February, Karan Bajaj said April was really bad, that there was practically no sale in May and June in quarter one last year, and that air coolers and refrigerators were next to zero.
So Q1 FY27 was genuinely very good. It was also measured against a crater.
What does Electronics Mart actually do?
The business is simple enough to explain in one paragraph.
You walk into an Electronics Mart store looking for an AC, a fridge, a washing machine, a television or a phone. Instead of one brand, you get Samsung, LG, Sony, Daikin, Blue Star, Vivo, Oppo, OnePlus and others under the same roof. You look at four options, a salesman explains the difference, you buy one, often on an EMI arranged in the store.
That is it. At the end of Q1 FY27 the company ran 227 stores — 220 multi-brand outlets and 7 exclusive brand outlets — across more than 100 cities.
It makes money on the spread between what it pays the OEM and what it charges you. In FY26 that spread was 14.4%. Out of it come salaries, rent, marketing, warehousing and logistics. FY26 revenue was ₹7,183 crore and PAT was ₹107 crore. Roughly one and a half rupees kept on every hundred of sales.
The Q1 FY27 mix was 48% large appliances, 39% mobiles, and 13% small appliances, IT and others. That mix matters because the legs are not equally profitable. Mobiles are high turnover and low margin. Large appliances, especially cooling products, carry better margins — which is one reason profitability can swing hard from quarter to quarter on nothing more than the weather.
The one accounting point you need
I am going to use the words "pre Ind AS" a few times, so here is what they mean in plain language.
192 of the 227 stores are leased. Under Ind AS 116, a lease is accounted for as though you bought the shop with a loan. The rent disappears from operating costs, an asset appears on the balance sheet, a lease liability appears next to it, and the rent reappears lower down the P&L as depreciation plus interest.
Ignore the complicated terms and think of it like this: you have leased a property, but Ind AS 116 lets it be shown as depreciation plus interest charges, which sit below EBITDA — thereby boosting EBITDA, because it no longer carries the rental.
So what we really care about is adjusted, pre-Ind AS EBITDA, which does deduct the lease rentals.
Q1 FY27, ₹ crore
Reported
Ind AS 116 impact
Pre Ind AS 116
Total revenue
2,419.0
—
2,419.0
Gross profit
417.2
—
417.2
Gross margin
17.2%
—
17.2%
Rent expense
0.0
39.3
39.3
EBITDA
238.9
—
199.7
EBITDA margin
9.9%
—
8.3%
Depreciation
41.6
26.4
15.2
Finance cost
37.2
25.1
12.2
PBT before exceptional items
162.1
—
174.3
So when the company reports a Q1 FY27 EBITDA margin of 9.9%, the margin that has actually paid the rent is about 8.3%. Electronics Mart deserves credit here, because it voluntarily discloses both numbers when it does not have to.
The cluster model
Electronics Mart does not scatter stores across India. It enters a geography, builds density, puts a warehouse and a delivery and service network around it, and spends on local marketing. Hyderabad first, then the rest of Telangana, then Andhra Pradesh, then NCR from 2022. West Bengal is next.
That single approach explains a lot. It explains why consolidated margins look as respectable as they do. It explains why the company keeps expanding, since the prize if the model travels is enormous. And it is the concentration risk sitting underneath everything else.
The uncomfortable part: it grew, and profits did not follow
₹ crore
FY22
FY23
FY24
FY25
FY26
Revenue from operations
4,349.3
5,445.7
6,285.4
6,731.3
7,183.3
Gross profit
593.9
740.7
914.7
997.5
1,037.1
Gross margin
13.7%
13.6%
14.6%
14.8%
14.4%
EBITDA
291.9
336.1
449.5
451.1
438.2
EBITDA margin
6.7%
6.2%
7.2%
6.7%
6.1%
Depreciation
71.3
85.4
105.7
126.7
156.2
Finance cost
84.6
98.5
107.7
117.5
153.7
Profit after tax
103.9
122.8
183.9
160.5
107.1
PAT margin
2.4%
2.3%
2.9%
2.4%
1.40%
Revenue up about 65%. Store count more than doubled. PAT in FY26 almost exactly where it was in FY22, having peaked at ₹184 crore in FY24. RoCE cut from 18.9% to 11.5%.
The mechanism is the two lines you can see above. Between FY22 and FY26, depreciation went from ₹71 crore to ₹156 crore and finance cost went from ₹85 crore to ₹154 crore. Together they rose by about ₹154 crore, while EBITDA over the same four years rose by about ₹146 crore.
The bull case, in one setup
At Q1 FY27, 96 stores were classified as mature and 131 were under four years old, with an average age of just 1.9 years.
Think about what a new store looks like. From day one it carries employees, rent, electricity and marketing. Say it does ₹20 crore of sales in year one. Over the next few years footfall builds, repeat customers accumulate, local brand recognition grows, and the same store does ₹30 crore or ₹40 crore.
Q1 FY27
Mature stores (>4 years)
Non-mature (<4 years)
Number of stores
96
131
Retail revenue
₹1,628 crore
₹676 crore
Total EBITDA
₹183 crore
₹55 crore
EBITDA margin
11.2%
8.1%
Costs do not double when sales double. That gap is operating leverage. Which means Electronics Mart does not need to open another hundred stores for profits to rise. It needs the ones it has already paid for to get busier.
The macro is real, but it is not the thesis
The underlying market does have structural support, and it is worth stating briefly.
IBEF expects India's consumer durables industry to grow at around 11% CAGR to roughly ₹3 lakh crore by FY29, and estimates around 30% of the industry is still unorganised. The IEA estimates only about one in five Indian households currently owns an air conditioner, with cooling demand potentially more than doubling by 2035. And in September 2025, GST on ACs and dishwashers came down from 28% to 18%, with larger televisions also moving to 18%.
Put together: penetration is low, consumers are trading up, organised retail is gaining share, and large appliances just got cheaper.
That is a genuinely good backdrop. But every organised retailer in India gets that backdrop. It is not what makes Electronics Mart interesting or dangerous. Execution is.
NCR is the proof point
Their penetration into the South has worked. The question has always been whether it travels.
For FY26, NCR store-level EBITDA margin was around 0.2–0.3%, against 6.5% in the South. Management targeted 2.5% to 3% for FY27 on a pre-Ind AS basis.
Q1 FY27 came in at 4.9%. South was 10.9%. Both are store-level figures that exclude corporate and warehouse costs, which is why they run above the company margin.
For me the 4.9% is the most important number in the entire quarter, more than the 39% or the 458%. It is the first hard evidence in four years that the cluster playbook is not a Telangana-only phenomenon.
And it gets better when you notice the context. NCR's same-store growth was only 14.6%, the weakest of the four clusters, and management explained why: the cooling products market in the North was negative this year. So NCR delivered that margin without the tailwind that made the South look spectacular.
I would not declare victory on one quarter. Q2 and Q3 are when NCR's structural cost disadvantage — higher rent, higher marketing, and competition from Croma, Reliance and Vijay Sales — shows up without a summer to hide behind. But this is now the number I would check first, every quarter.
And the company is spending again
Based on the Q1 call, FY27 store additions are now expected at 25 to 30: roughly 10 to 12 in West Bengal, 8 to 10 in NCR, around 5 in the South. That is higher than the roughly 20 discussed at Q4 FY26. Capex is about ₹100 crore for new stores plus about ₹50 crore for property purchases in Kolkata over two years, all funded internally.
Kolkata is the next test, and worth being clear-eyed about. NCR took four years to reach 4.9%. A new cluster starts with low throughput, front-loaded marketing and a learning curve management itself described at Q4 as a 12 to 14 month cycle before things work on the floor.
So FY27 has two forces pulling against each other. Older stores maturing, which adds margin. And 25 to 30 new stores opening, which subtracts it. Which force wins is the entire question.
What management is actually guiding, and why it is the best signal in the release
FY26 revenue was ₹7,183 crore. Growth of 18–20% gives ₹8,476 to ₹8,620 crore. Q1 has already banked ₹2,419 crore. So the remaining nine months only need ₹6,057 to ₹6,201 crore against ₹5,444 crore last year. That is 11% to 14% growth for the rest of the year, against 39% in Q1.
Same for margins. The full-year gross margin guide implies roughly 14.1% to 14.8% for the remaining nine months, against 14.4% in the comparable nine months of FY26 — essentially flat. The EBITDA guide implies roughly 6.6% to 7.3%, against 6.0%.
Put it the other way. Hold Q1's 9.9% margin all year on ₹8,500 crore and you would print around ₹840 crore of EBITDA. They are guiding ₹636 to ₹690 crore.
And they were pushed on it three times on the same call. Manoj Gori asked whether 18–20% was too conservative given the strong start. Rupesh Tatiya asked whether 8–9% EBITDA margin was modellable, and was told 8–9% is too optimistic and 7.5–8% is more achievable. Zaki Nasir asked whether ₹10,000 crore of revenue was possible this year, and was told the comfortable guidance stays at 18–20%.
Three analysts tried to talk them up. They declined each time. Managements that talk down their own upside after a blowout quarter are considerably rarer, and considerably more useful, than the ones who do the reverse.
They also told you exactly why Q1 will not repeat. Gross margin was helped by a heavier cooling-product mix, which carries better margins, and by inventory bought before price increases in mobiles and laptops. The second of those is a one-off by definition. You get it once, when prices rise and you happen to be holding cheap stock.
So Q1 has built a very comfortable cushion. The question is how much of it survives.
What I am tracking from here
What
Why
Revenue growth
The full-year guide needs only 11–14% from the remaining nine months. Materially above that means the demand story is stronger than management currently assumes
Gross margin
Q1's 17.2% should normalise, and that is fine. What I want is for it to settle around the guided 15–15.5% rather than falling back to older levels
EBITDA margin expansion
The big one. If the store-maturity thesis is right, EBITDA should start growing faster than revenue. That is the whole argument
PAT conversion
The historical failure point. Depreciation and finance cost ate the entire incremental EBITDA of the last expansion cycle. Watch whether they do it again
NCR margin outside the summer
4.9% in Q1 was ahead of the 2.5–3% target. Q2 and Q3 are the honest test
What are you paying for it?
Market cap is around ₹6,960 crore at the time of writing. There is no PAT guidance, so what follows is my estimate, not the company's.
Management's revenue and EBITDA guidance implies FY27 EBITDA of roughly ₹636 to ₹690 crore. Assume depreciation rises towards ₹175 to ₹180 crore as stores are added, finance costs land around ₹140 to ₹145 crore given management guided them roughly ₹10 crore below FY26, and tax stays near the historical effective rate of about 26%.
That gives FY27 PAT of roughly ₹240 to ₹275 crore, against ₹107 crore in FY26. At the current market cap that is about 29x on ₹240 crore, 27x on ₹260 crore and 25x on ₹275 crore. Call it 25–29x my estimated FY27 earnings, with roughly 27x as a midpoint. The depreciation assumption is the loosest link in that chain, and it is mine.
So, 27x for a management guidance of 18–20% revenue growth. I know it might seem high. But a lot depends on execution and the pace. If they are genuinely conservative and they hit it out of the park on the numbers I would be tracking, then 27x might seem reasonable given they might hit 30% growth. Else, things might falter.
That is why tracking and keeping up with the story becomes very important.
12 min read
Members only03 Sept
How EV 2 wheeler space is looking
How EV 2 wheeler space is looking.
This entry is part of the members' archive. The full note continues for another eleven paragraphs, along with the underlying working and the spreadsheet built while reading through the filings.
It closes with the two questions worth putting to management on the next call, and what would have to change for the view to change with it.
This entry is part of the members' archive. The full note continues for another eleven paragraphs, along with the underlying working and the spreadsheet built while reading through the filings.
It closes with the two questions worth putting to management on the next call, and what would have to change for the view to change with it.
The shift happening in some Indian auto part makers
The shift happening in auto parts segment.
This entry is part of the members' archive. The full note continues for another eleven paragraphs, along with the underlying working and the spreadsheet built while reading through the filings.
It closes with the two questions worth putting to management on the next call, and what would have to change for the view to change with it.
Sansera Engineering Q1 FY27, and what to look for from here onwards
Sansera’s existing auto business continues to grow well, while its newer businesses — especially Aerospace, Defence and Semiconductor equipment — are growing much faster.
This entry is part of the members' archive. The full note continues for another eleven paragraphs, along with the underlying working and the spreadsheet built while reading through the filings.
It closes with the two questions worth putting to management on the next call, and what would have to change for the view to change with it.
How ageing grids, data-centre electricity demand and equipment shortages are creating an opportunity for TD Power Systems.
This entry is part of the members' archive. The full note continues for another eleven paragraphs, along with the underlying working and the spreadsheet built while reading through the filings.
It closes with the two questions worth putting to management on the next call, and what would have to change for the view to change with it.
This entry is part of the members' archive. The full note continues for another eleven paragraphs, along with the underlying working and the spreadsheet built while reading through the filings.
It closes with the two questions worth putting to management on the next call, and what would have to change for the view to change with it.
Audio note on Netweb Technology business coverage.
This entry is part of the members' archive. The full note continues for another eleven paragraphs, along with the underlying working and the spreadsheet built while reading through the filings.
It closes with the two questions worth putting to management on the next call, and what would have to change for the view to change with it.
Craftsman Automation: Understanding the business, growth story and what comes next
Craftsman is no longer a simple "auto industry grows so Craftsman grows" story — there are now several growth engines firing at different times. The question is whether the money already invested converts into revenue, margins and return ratios.
This entry is part of the members' archive. The full note continues for another eleven paragraphs, along with the underlying working and the spreadsheet built while reading through the filings.
It closes with the two questions worth putting to management on the next call, and what would have to change for the view to change with it.
Macro research is not only about seeing a trend and jumping into it. It’s about identifying the theme and then going deeper into the actual companies and value chain.
This entry is part of the members' archive. The full note continues for another eleven paragraphs, along with the underlying working and the spreadsheet built while reading through the filings.
It closes with the two questions worth putting to management on the next call, and what would have to change for the view to change with it.
Indian pharma spent thirty years learning to sell cheap. The next decade belongs to whoever can make the hard stuff.
This entry is part of the members' archive. The full note continues for another eleven paragraphs, along with the underlying working and the spreadsheet built while reading through the filings.
It closes with the two questions worth putting to management on the next call, and what would have to change for the view to change with it.
How aerospace supply chains actually work and the theme that makes Indian aerospace sector interesting.
This entry is part of the members' archive. The full note continues for another eleven paragraphs, along with the underlying working and the spreadsheet built while reading through the filings.
It closes with the two questions worth putting to management on the next call, and what would have to change for the view to change with it.
Lenskart is screaming growth and we must not miss it
Lenskart is a growth story that if executed well, can create the next multibagger — but execution is the key.
Key metrics
Metric
Value
India stores
+116 net adds in Q1 FY27
2,725
International stores
+16 net adds in Q1 FY27
734
India revenue growth (YoY)
₹1,531 crore
+30.7%
India EBITDA margin
up from 13.3% last year
15.4%
International revenue growth (YoY)
₹1,203 crore; ~29% in constant currency
+38%
International EBITDA margin
up from 4.5% last year
10.6%
Consolidated PAT growth (YoY)
₹228 crore
+182%
India same-store sales growth
18.3%
India same-pin-code sales growth
24%
Eye tests conducted, Q1 FY27
+42.7% YoY
63 lakh
The business model
Lenskart sells eyewear — a simple business on paper. The interesting part isn't what it sells, it's how it sells, and the size of the gap it's trying to close.
Roughly 78 crore Indians need vision correction today, potentially rising to 94 crore by FY30, but a much smaller share is actually tested or wearing eyewear — a large diagnosis-and-access gap. Lenskart's bet is to test more eyes, help people discover they need correction, convert them into eyewear customers, and use that demand to justify opening more stores. Eye tests sit at the centre of this flywheel: management says roughly 35,000 Indians walk into a Lenskart store every single day and discover for the first time that they cannot see clearly.
Filling the gap
Lenskart describes its India expansion in three words — Deeper, Wider, Further.
Deeper means adding density inside its 1,517 existing pin codes, which rose from 1.5 to 1.6 stores per pin code; despite that densification, same-store sales grew roughly 18% and same-pin-code sales grew roughly 24%, meaning demand is currently being added rather than divided between stores.
Wider means entering unserved pin codes within cities Lenskart already operates in — of 2,821 identified whitespace pin codes, only about 152 have been entered so far, leaving over 2,650 still unserved.
Further means entirely new towns, such as Hassan, Balasore, Tura and Gandhidham — around 140 entered so far.
Over the last nine months Lenskart added roughly 455 net India stores, consuming only about 5% of the roughly 6,400-pin-code whitespace management has mapped; put together, management believes India alone can eventually support more than 10,000 stores, against roughly 2,725 today — and this isn't purely a metro story, with several Tier-2+ stores among the strongest new-store cohorts.
Remote optometry — eye tests conducted at home rather than requiring an in-store optometrist — has scaled from 168 stores at the end of FY25 to 786 now, and is one of the key unlocks making smaller-town expansion viable, since qualified optometrists are hard to staff in Tier-2/3 locations.
Internationally the approach is more measured and market-by-market: Singapore and the UAE are mature, Thailand is seeing aggressive additions, the Middle East is a focus, Japan is nearing the economics to accelerate, and Saudi Arabia remains early-stage.
Where the next leg of growth can come from
On the numbers, India grew volume-led — eye tests up 42.7% YoY to 63 lakh, eyewear units up 22.8% to 82 lakh — while margins expanded alongside growth rather than at its expense. International grew even faster than India and now contributes roughly 44% of the combined India-plus-international revenue pool, no longer a side bet.
At the consolidated level, revenue grew 34% YoY while PAT nearly tripled, with roughly a third of revenue growth translating into post-rent EBITDA doubling — the operating-leverage story starting to show.
Behind the store network, Lenskart is also investing in manufacturing: Q1 FY27 plant capex of ₹75 crore in stores plus ₹132 crore largely tied to the Hyderabad manufacturing facility, building the backend capacity a much larger future store count and eyewear volume will require.
What to track from here
Eye-test growth relative to eyewear-unit growth — since eye tests are currently outpacing eyewear volume, that gap is itself a future conversion lever.
Same-store versus same-pin-code sales growth — as long as same-pin-code growth stays ahead of same-store growth, the densification thesis holds rather than tipping into cannibalization.
The ₹500 affordable category, which carries real down-trading risk if existing ₹1,500–2,000 customers simply shift down rather than the category bringing in genuinely new customers.
International margins on a full-year basis rather than annualising a seasonally strong sunglasses-heavy Q1, and the pace of Hyderabad-driven capacity build against overall cash generation.
The real open question isn't whether Lenskart has enough growth opportunities — it clearly does — it's whether it can execute all of these growth engines together without hurting customer experience, margins, store productivity, or cash generation.
Reading the small-finance bank concalls back to back — the deposit-mix story nobody is pricing
Four transcripts, one common thread: the margin pressure everyone is calling a yield problem looks much more like a cost-of-funds problem. Where I think the market is reading the wrong line item.
This entry is part of the members' archive. The full note continues for another eleven paragraphs, along with the underlying working and the spreadsheet built while reading through the filings.
It closes with the two questions worth putting to management on the next call, and what would have to change for the view to change with it.
Q1 tracker: what changed in the four positions I hold on watch
Guidance held in three of four. The one that moved did so on a mix shift rather than demand — which is the distinction that decides whether it matters.
This entry is part of the members' archive. The full note continues for another eleven paragraphs, along with the underlying working and the spreadsheet built while reading through the filings.
It closes with the two questions worth putting to management on the next call, and what would have to change for the view to change with it.
Unravelling the deeper macro theme developing in the Indian pharma space. India got very good at making the same medicine cheaper than anyone else — and that is exactly the skill the market has stopped paying for. What every large Indian pharma company is quietly rebuilding around instead.
I’ve been going through a bunch of Indian pharma companies recently and one common theme keeps coming up.
India has traditionally been very good at one thing in pharma: making generic medicines at scale and at a low cost.
But there is a problem with that model. If 10 companies can make the same generic tablet, eventually everyone starts competing on price. And that is exactly what we are seeing in markets like the US.
So companies are now trying to move into areas where not everyone can compete — complex generics, injectables, inhalers, peptides, biosimilars, specialty drugs, CDMO.
Sounds like a lot of jargon, but the idea is actually simple: make things that are harder to make.
And this isn’t just something I’m concluding. Zydus itself talks about moving from volume-led generics towards higher-value specialty products.
How does the pharma value chain work?
To make this note more readable, let’s first understand how the pharma value chain works. At a very simple level:
A medicine starts with an API, or Active Pharmaceutical Ingredient. Think of the API as the actual chemical that produces the medical effect.
That API is then converted into a finished medicine. This finished medicine is called a formulation.
The formulation then goes through regulatory approvals before it can be sold in a particular market.
So broadly: API manufacturing, then formulation manufacturing, then regulatory approval, and finally the sale of the medicine.
Different Indian pharma companies participate at different points in this chain.
Divi’s is primarily an API and custom-synthesis manufacturer.
Cipla, Torrent, Lupin and Sun Pharma are much more focused on finished medicines.
Laurus participates across APIs, formulations and increasingly CDMO (we’ll come to this later).
What exactly is a generic medicine?
That distinction becomes important when we understand where the industry is moving.
Suppose a global pharmaceutical company discovers a new medicine. It spends years on research, trials and regulatory approvals, and generally gets patent protection around that product.
Once the relevant patent protection expires, other pharmaceutical companies can manufacture equivalent versions of that medicine. Those are called generic drugs.
India became extremely successful at this business. Indian companies developed the capability to manufacture generic drugs cheaply and at enormous scale, and supply them across the world. This has been one of India’s biggest advantages in global pharma.
But there is a problem. If ten companies can manufacture the same generic tablet, eventually the competition becomes largely about price. More competitors enter. Customers negotiate harder. Prices fall. And margins can come under pressure.
Torrent explicitly highlights pricing pressure and price erosion in generic markets such as the US and Germany. Zydus similarly identifies intense generic competition as a risk, and says its response is to move up the value chain through complex products with higher entry barriers.
From simple generics to difficult-to-copy medicines
And this appears to be one of the most important shifts happening across Indian pharma today.
A normal generic could be a relatively straightforward tablet. A complex generic is still based on an existing medicine, but it is much harder to develop and manufacture. Examples include:
inhalers
complex injectables
peptide products
transdermal patches
drug-device combinations
long-acting formulations
Why does complexity matter? Because if a medicine is difficult to manufacture, develop and get approved, fewer companies may be capable of entering that market.
So companies are trying to move away from products where many manufacturers can compete mainly on price, towards products where technical capability, R&D and regulatory expertise create barriers to entry.
Zydus describes this transition very clearly. It says it is moving from volume-led generics towards innovation-driven, high-value specialty segments.
Lupin is building a pipeline with 45+ injectables and 20+ inhalation products, and is also expanding into biosimilars and specialty products.
Cipla is investing in respiratory medicines, peptide injectables, biosimilars, complex formulations and drug-device combinations.
Torrent’s pipeline also includes complex generics, injectables, biologics, oncology and other differentiated products.
So even though these companies have different business models, the direction is similar: make products that are harder for competitors to replicate.
What are biosimilars?
There is another layer above traditional generics.
Many newer medicines are biological drugs, which are much more complicated than normal chemically manufactured medicines. The generic-like equivalent of a biologic is called a biosimilar.
These are significantly harder to develop and manufacture than a normal generic tablet. That is why companies such as Lupin, Zydus, Cipla and others are investing in this area.
Again, the attraction is similar: higher complexity, stronger regulatory requirements, fewer capable competitors.
Sun Pharma is taking this one step further
Most of the discussion so far has been about making increasingly difficult versions of existing medicines. Sun Pharma is also moving towards Innovative Medicines.
Here the company is increasingly participating in medicines that are more differentiated and closer to the traditional global innovative-pharma model. Sun says the contribution of branded generics and Innovative Medicines has steadily increased, reducing its dependence on more commoditised opportunities.
So Sun Pharma is effectively taking the value transition further: not only making more difficult generics, but increasing exposure to differentiated and innovative medicines.
The API manufacturing companies are moving up the value chain too
For companies such as Laurus and Divi’s, the shift looks different. They are not primarily trying to create brands that doctors prescribe. Their opportunity lies in becoming a more important partner to global pharmaceutical companies.
This is where CDMO becomes important. CDMO stands for Contract Development and Manufacturing Organisation.
Imagine a global pharma company develops a new drug. Instead of building every manufacturing capability internally, it can ask a company such as Laurus to help with:
developing the manufacturing process
producing material for clinical trials
scaling manufacturing
supplying the API
eventually manufacturing commercial volumes
So there is a big difference between “sell me 10 tonnes of this API” and “work with me from the development stage and help manufacture this drug for the next several years”. The second relationship is deeper and much more technically involved. That is the CDMO opportunity.
Laurus’ Q1 FY27 numbers show how meaningful this shift has become. CDMO revenue grew 67% YoY and represented around 43% of total revenue. At the same time, revenue grew 29%, EBITDA grew 66% and EBITDA margin increased from 24.8% to 31.8%, with management attributing the improvement partly to favourable business and product mix.
Divi’s also saw a higher contribution from custom synthesis in Q1, with management noting somewhat better margins — although the company cautioned that quarterly mix can be lumpy.
So on the manufacturing side, the shift is essentially: from being a supplier to becoming a development and manufacturing partner.
Why is the industry making this shift now?
There appear to be a few structural reasons.
1. Traditional generics are getting increasingly competitive
This is probably the most basic driver. When many companies manufacture the same generic drug, pricing pressure becomes inevitable. Therefore companies increasingly need products where fewer competitors can enter.
That is why words such as complex, differentiated, limited competition, specialty and biologics keep appearing across these companies’ filings.
2. A large global patent-expiry cycle is coming
A large number of global drugs will lose patent protection over the coming years. Torrent highlights a significant patent-expiry opportunity, while broader industry estimates point to roughly $200 billion+ of branded-drug revenues facing loss of exclusivity by 2030.
When a drug loses exclusivity, generic or biosimilar manufacturers can potentially enter. The important difference this time is that many of the drugs losing exclusivity are increasingly more complicated products and biologics. So you are technically getting access to produce more complex medicine products when the patent expires.
So the opportunity is not simply “who can make the cheapest tablet?” It can increasingly become “who actually has the technical and regulatory capabilities to make this product?” That plays directly into the capabilities Indian pharma companies are currently building.
3. Chronic diseases are creating very large markets
The other major structural opportunity is the growing burden of diabetes, obesity, cardiovascular diseases, oncology, neurological diseases and other chronic illnesses. Torrent highlights increasing cardiovascular and metabolic disease burden, particularly across emerging markets.
GLP-1 drugs are a good current example.
Torrent has launched Semaglutide in oral and injectable formats.
Zydus launched three differentiated Semaglutide formulations in March 2026.
Cipla has also entered obesity treatments through generic Liraglutide, while building peptide capabilities.
So GLP-1 is not the entire pharma theme. But it is a good example of how large chronic-disease markets, patent expiries and improving Indian manufacturing capabilities can come together.
4. Global pharma is outsourcing more work
Another important opportunity is manufacturing outsourcing. Instead of global pharma companies doing everything internally, parts of drug development and manufacturing are increasingly outsourced to specialist partners. That creates opportunities for Indian CDMO companies.
Laurus highlights rising outsourcing and increasing demand for end-to-end development and manufacturing services. Torrent also highlights supply-chain diversification and the China Plus One opportunity for Indian pharmaceutical manufacturing. Even Zydus has entered biologics CDMO through the acquisition of US manufacturing facilities.
So another part of the macro story is India trying to capture a greater share of global pharmaceutical development and manufacturing, not just generic drug sales.
What does all of this mean financially?
This is the most important part from an investing perspective.
It would be incorrect to say: higher-value medicine = automatically higher margin.
Complex products require substantially more R&D, capex, regulatory work, time and execution capability. Some products may also fail or face unexpected competition.
But if the strategy works, a company can potentially move towards fewer competitors, a better product mix, stronger pricing, better utilisation and higher margins.
Laurus already gives us one example where stronger CDMO contribution and better product mix have coincided with significant margin expansion. Cipla management has similarly said upcoming differentiated products carry healthy margins, and that product mix remains important for profitability.
The bigger Indian pharma story
For decades, India’s pharmaceutical advantage was largely low manufacturing cost, large scale and generic medicines.
The next stage companies appear to be trying to build towards is more value addition and complex manufacturing. And that is opening up opportunities across complex generics, inhalers, injectables, peptides, biosimilars, biologics, specialty medicines, Innovative Medicines and CDMO.
So the broader macro theme can perhaps be summed up in one line: Indian pharma is gradually moving from a volume-led industry towards a value-led industry, trying to capture more value from each medicine it develops or manufactures rather than simply producing more medicines.
And that’s where the company-level analysis becomes interesting. Because now the question isn’t just “which pharma company is growing fastest?”
It’s: which company is actually moving up the value chain, how much of its revenue is already coming from these higher-value areas, is that improving margins and returns, and how much of that opportunity is already reflected in the valuation?